Trends in wait times for scheduled surgeries in British Columbia
Issue: BCMJ,
vol. 67 , No. 6 , July August 2025 ,
Pages 210-216 Original Research
ABSTRACT
Background: Canada has substantially longer surgical wait times than several other Organisation for Economic Co-operation and Development member countries with universal health care. In British Columbia, lengthy surgical wait times are an ongoing problem.
Methods: We used the BC Surgical Wait Times database to examine trends in wait times and surgical demand across hospitals (n = 59), cities, surgical specialties, and health authorities in BC from 2009 to 2022.
Results: In general, small hospitals had the shortest wait times. Before 2013 and after 2018, medium-sized hospitals generally had longer wait times than large hospitals. Small and medium-sized cities generally had the longest wait times, and rural communities had the shortest. There were no trends in wait times by health authority. Demand was highest in small hospitals, rural communities, and the Interior Health Authority; it was lowest in large hospitals, large cities, and the Provincial Health Services Authority. Across all specialties, otolaryngology, orthopaedic surgery, and plastic surgery had the longest wait times, while neurosurgery and thoracic surgery had the shortest. Demand for ophthalmology was almost eightfold that of any other specialty. Spikes in wait times and decreases in demand occurred during the COVID-19 pandemic across almost all analyses.
Conclusions: Overall, our analysis suggests that demand does not predict wait times for scheduled surgery in BC. Further investigation should be conducted to better understand predictors of wait times in BC.
An analysis of the period 2009–2022 suggests that small hospitals had the shortest wait times and that the demand for surgery was greatest in small hospitals, rural communities, and the Interior Health Authority. The longest wait times were for otolaryngology, orthopaedic surgery, and plastic surgery.
Background
While lengthy wait times for scheduled surgeries are a global problem, Canada has substantially longer surgical wait times than other Organisation for Economic Co-operation and Development (OECD) member countries with universal health care.[1] Among eight such countries, Canada was consistently below average for all timelines-of-care indicators and ranked last for surgical wait times, with the largest proportion of patients waiting more than 2 months for elective surgery.[2] In a study conducted between March and June 2020, 38% of Canadians reported having to wait 4 months or longer for scheduled surgery, a far larger percentage than citizens of the Netherlands (13%), France (10%), Switzerland (6%), and Germany (1%).[1] Within Canada, British Columbians in particular face long wait times for scheduled surgical procedures.[3] As of 2022, more than 82 000 patients were on British Columbia’s elective surgical wait lists, with more than 40% waiting longer than the federal government’s benchmark limit of 26 weeks.[4,5]
These increased wait times have consequences for patient health and wellness. From a physiological perspective, increased wait times can lead to deterioration in a patient’s medical condition, heightened pain, increased surgical complexity, and poorer health outcomes.[6,7] Psychologically, increased wait times can lead to diminished quality of life and reduced capacity to engage in daily activities;[8,9] economically, they can lead to lost wages and increased health care costs.[10,11] These impacts are further exacerbated in rural and remote communities and among Indigenous populations and other marginalized groups.[12,13]
The publicly available BC Surgical Wait Times (BCSWT) database tracks quarterly data on scheduled surgical wait times by hospital, health authority, and procedure, for patients of all ages.[14] Health authorities submit patient booking and postoperative information from their operating room booking system to the registry daily.[14] Therefore, the database is limited to scheduled inpatient and day surgeries and does not include people waiting for surgery that is yet to be scheduled; further, it is subject to institution-specific booking practices. Surgeries are reported using a standardized set of procedure codes across the province. Our objective was to provide an overview of the recent state of surgical wait times in BC using BCSWT data.[15]
Methods
Data were analyzed from Q2 2009 (i.e., April to June) to Q1 2022 (i.e., January to March). The BCSWT database reports wait times using four main metrics: cases waiting, cases completed, 50th percentile (median) wait time, and 90th percentile wait time.
A full list of hospitals included in the database is provided in the Supplementary Table.
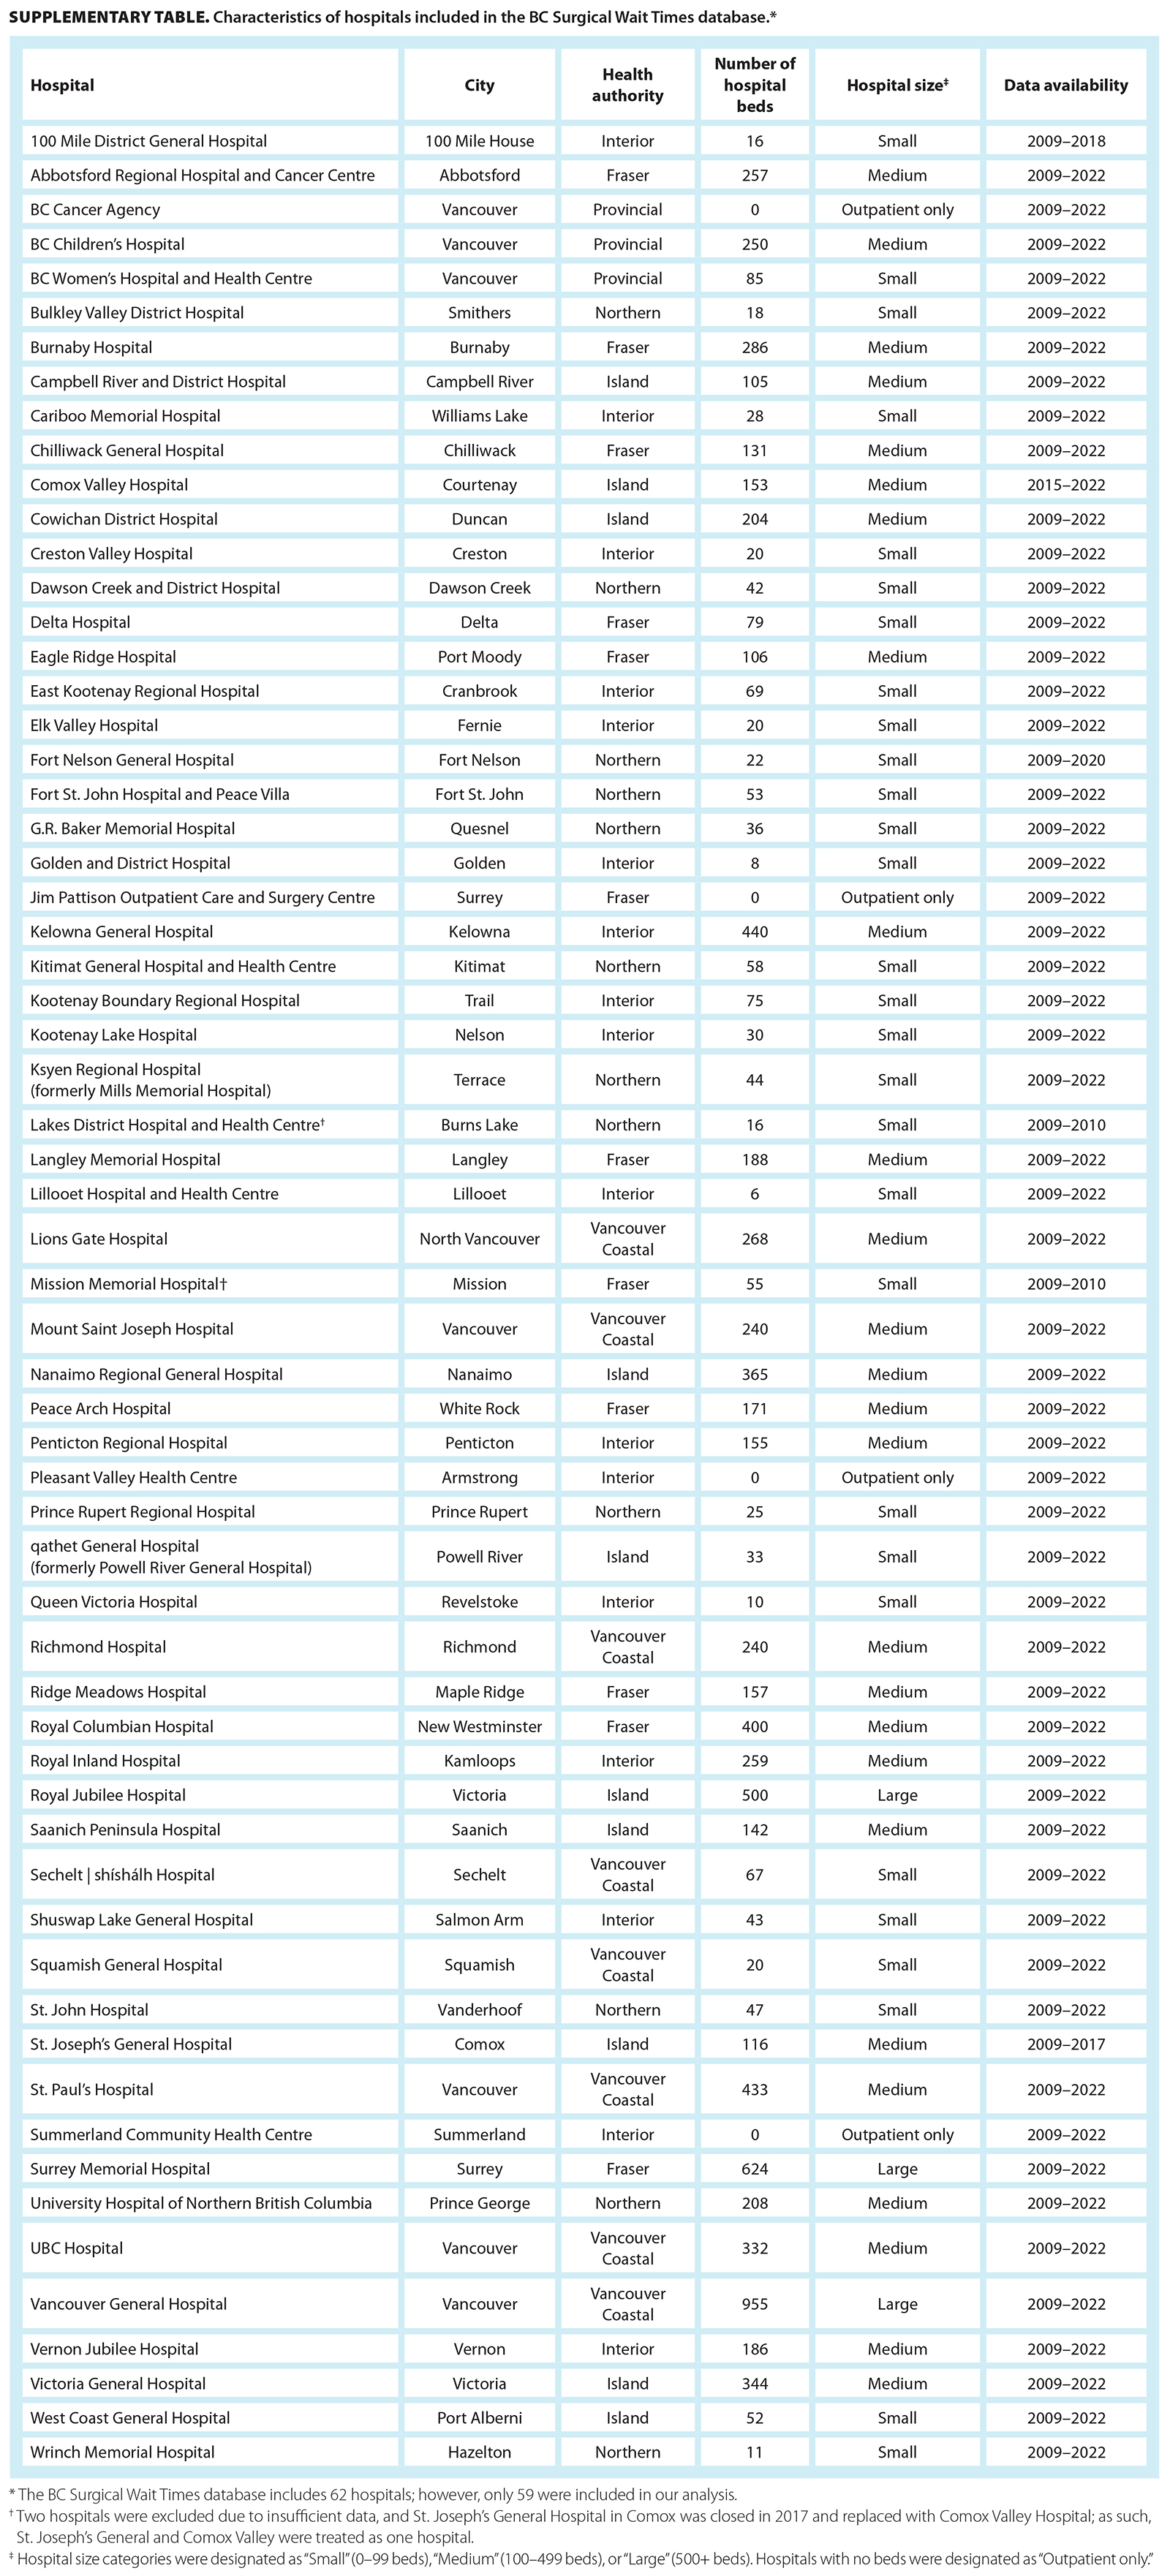
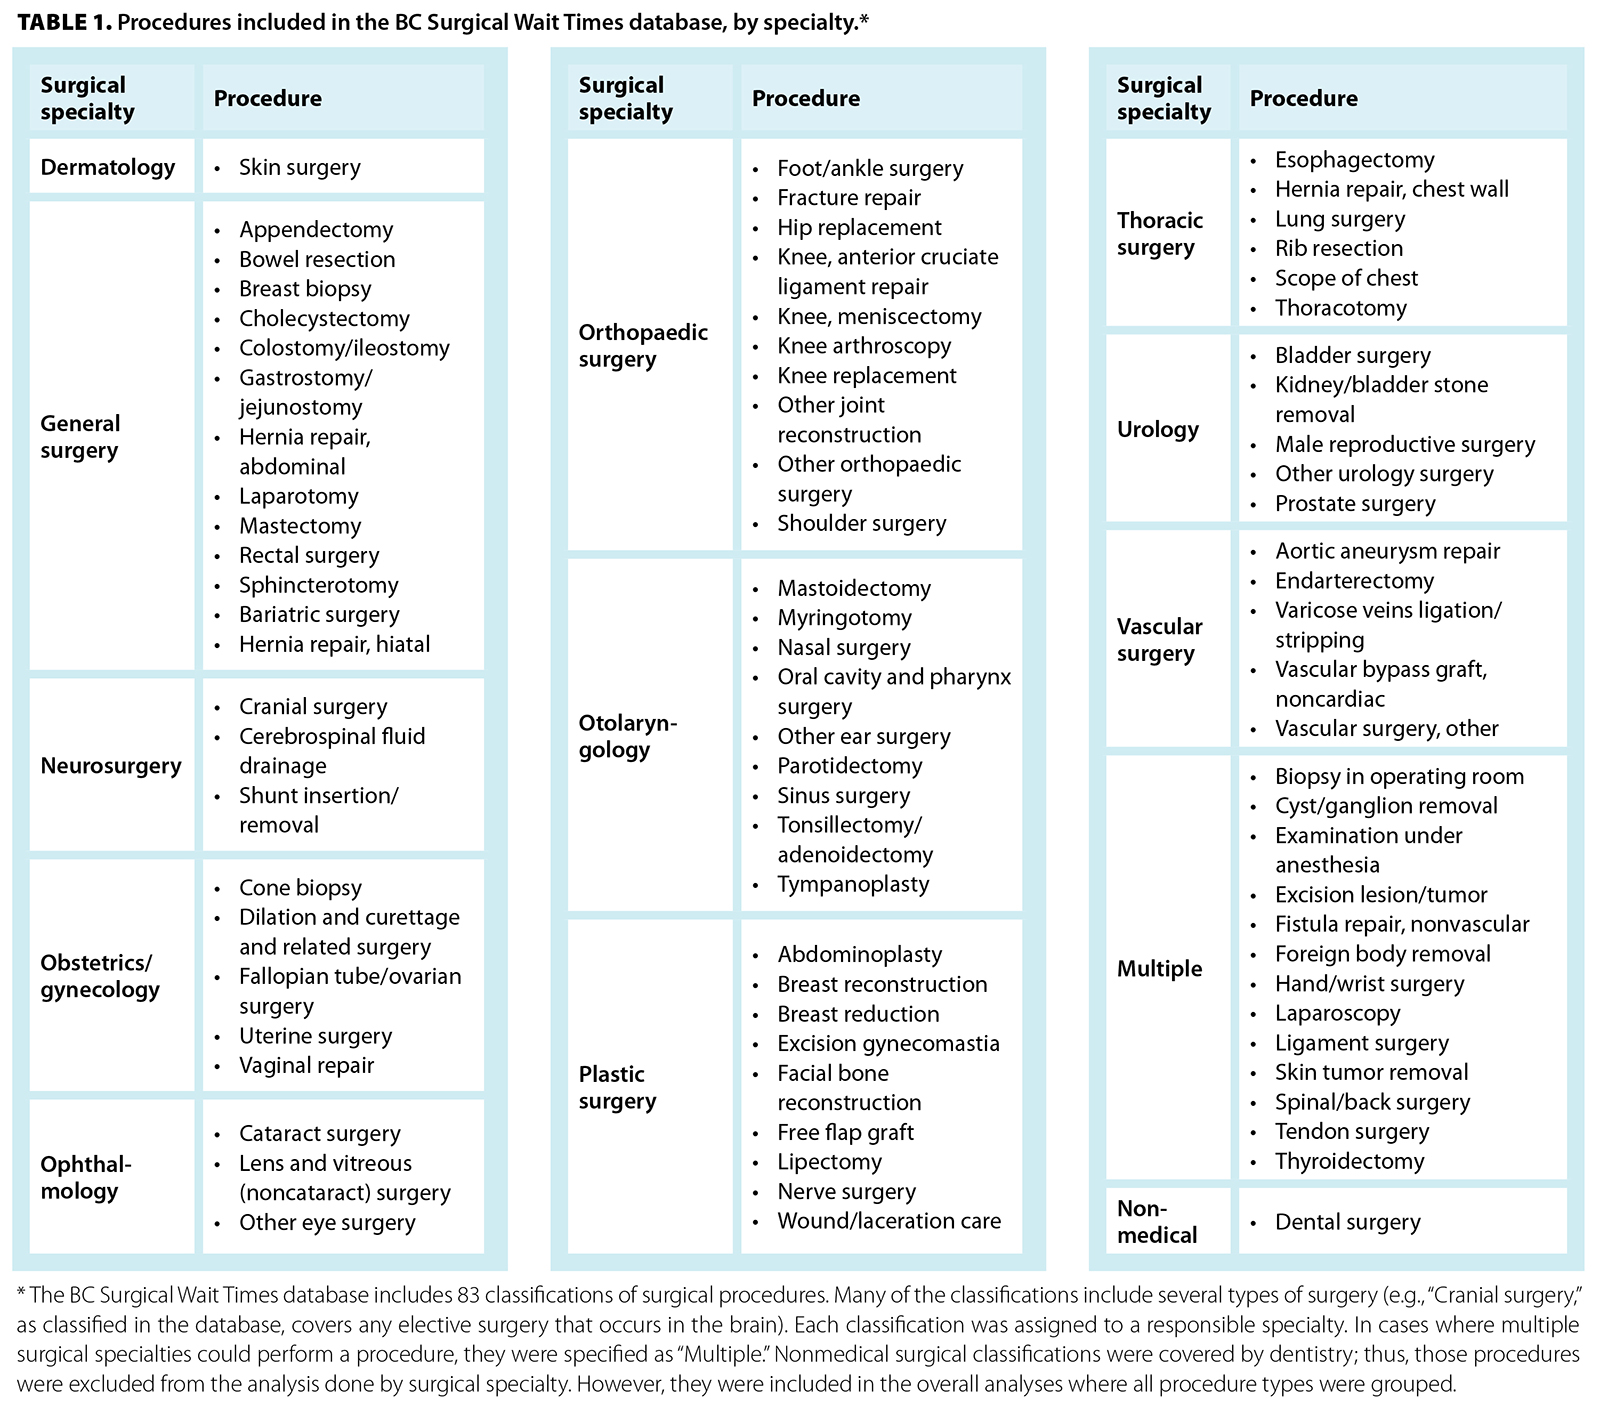 Median wait times by hospital size, city size, specialty, and health authority were plotted over time using Microsoft Excel. Hospital size was based on the number of beds: small (1 to 99 beds), medium (100 to 499 beds), or large (500+ beds). For the hospital size analysis, outpatient-only surgical centers (0 beds; day surgeries only) were excluded, as their surgical capacity cannot be estimated by number of beds. City size was determined from the population census in 2021 and was divided into four groups based on Statistics Canada’s classification of community size: rural (1000 to 29 999 people), small (30 000 to 99 999 people), medium (100 000 to 499 999 people), and large (≥ 500 000 people).[16] For the city size analysis, hospitals that serve the entire province (e.g., BC Children’s Hospital, BC Women’s Hospital and Health Centre) were excluded from the analysis, because their city size does not reflect the population served. A single hospital that serves a population of fewer than 1000 was also excluded, because the output was not considered to be generalizable. For specialty, the 83 surgical procedures included in the BCSWT database were matched to the surgical subspecialties that perform them [Table 1]. Health authorities included the Fraser Health Authority, Interior Health Authority, Island Health Authority, Northern Health Authority, Vancouver Coastal/Providence Health Authority, and Provincial Health Services Authority.
Demand was defined as the number of patients waiting for a procedure plus the number of patients who underwent that procedure in a given quarter. To standardize demand by population, this number was converted to an index (i.e., demand per 1000 people) using the population served by each hospital. To perform this standardization, the population per city per year was estimated by using the population censuses from 2016 and 2021 to calculate the compound annual growth rate, assuming stability in growth rates over time. For surgical procedures that had a demand of less than 5, a value of 2 was input for calculability.
All data were publicly available; thus, no ethics approval was needed for this study.
Results
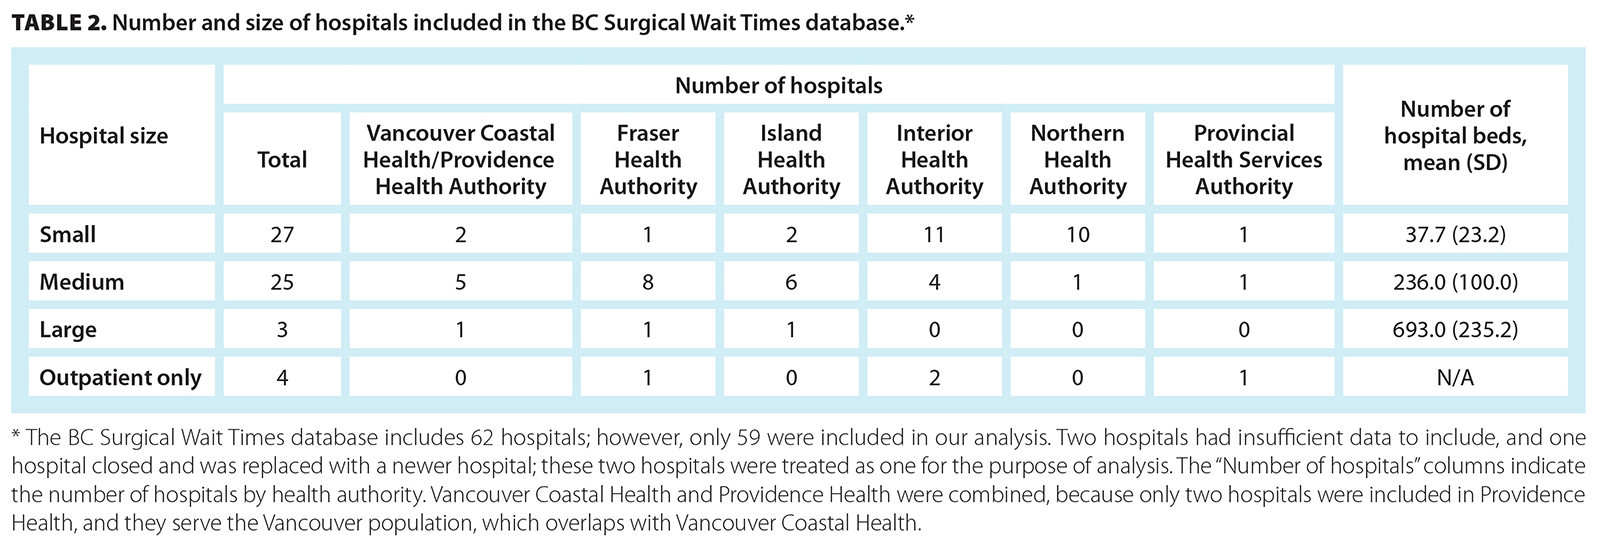
Of the 62 hospitals in the BCSWT, 59 were included in our analysis [Table 2]. Two hospitals were excluded due to insufficient data. Another hospital was closed and replaced by a newer institution; they were treated as one hospital.
 Overall wait times
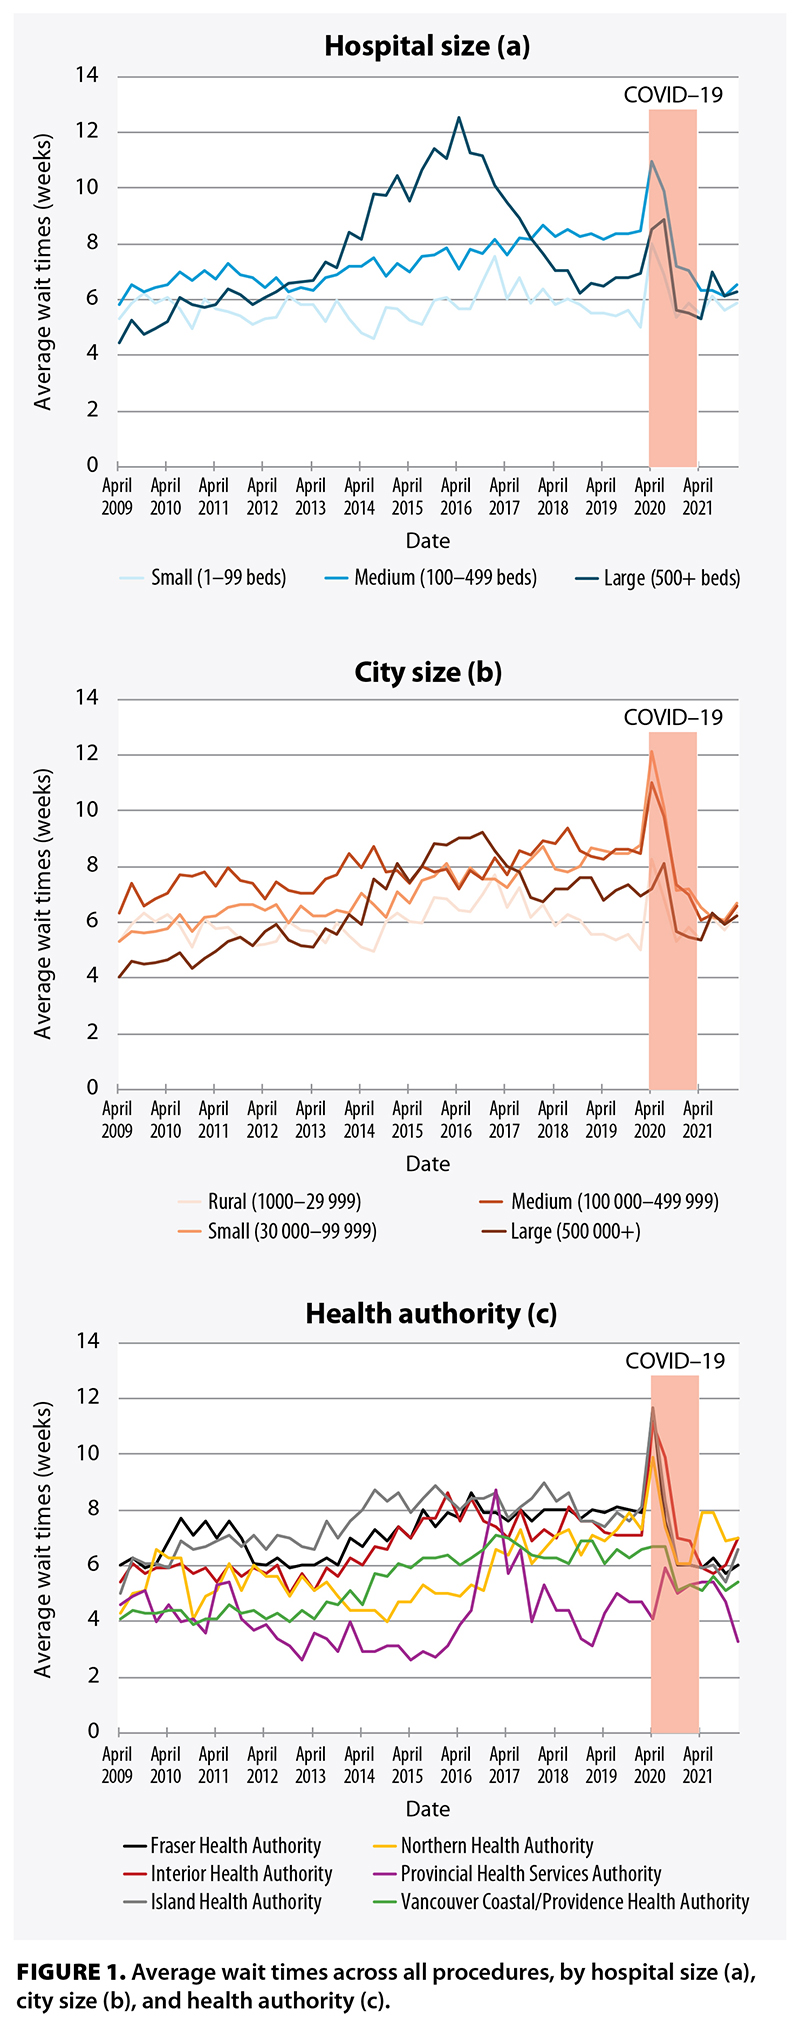
Before 2013 and after 2018, medium-sized hospitals generally had longer wait times than large hospitals. At large hospitals, wait times increased sharply between 2013 and 2016, then declined steadily to 2019. Wait times increased steadily between 2009 and 2019 at medium-sized hospitals and remained comparatively low at small hospitals throughout the study period [Figure 1a].
In general, small and medium-sized cities had the longest wait times, and rural communities had the shortest. Wait times did not vary meaningfully by city size until 2017, when rural communities and large cities began to show a decline in wait times relative to small and medium-sized cities. Wait times in small cities steadily increased between 2009 and 2017 and increased in large cities between 2013 and 2018 [Figure 1b].
There was a sharp increase in wait times in the Provincial Health Services Authority from 2016 to 2017, followed by a return to approximately baseline levels [Figure 1c]. As of 2021, the Provincial Health Services Authority had the shortest wait times, followed by the Vancouver Coastal/Providence Health, Fraser Health, Island Health, Interior Health, and Northern Health Authorities.
During the COVID-19 pandemic (April 2020 to March 2021), wait times spiked across all categories of hospital size, city size, and health authority [Figure 1].
 Overall demand
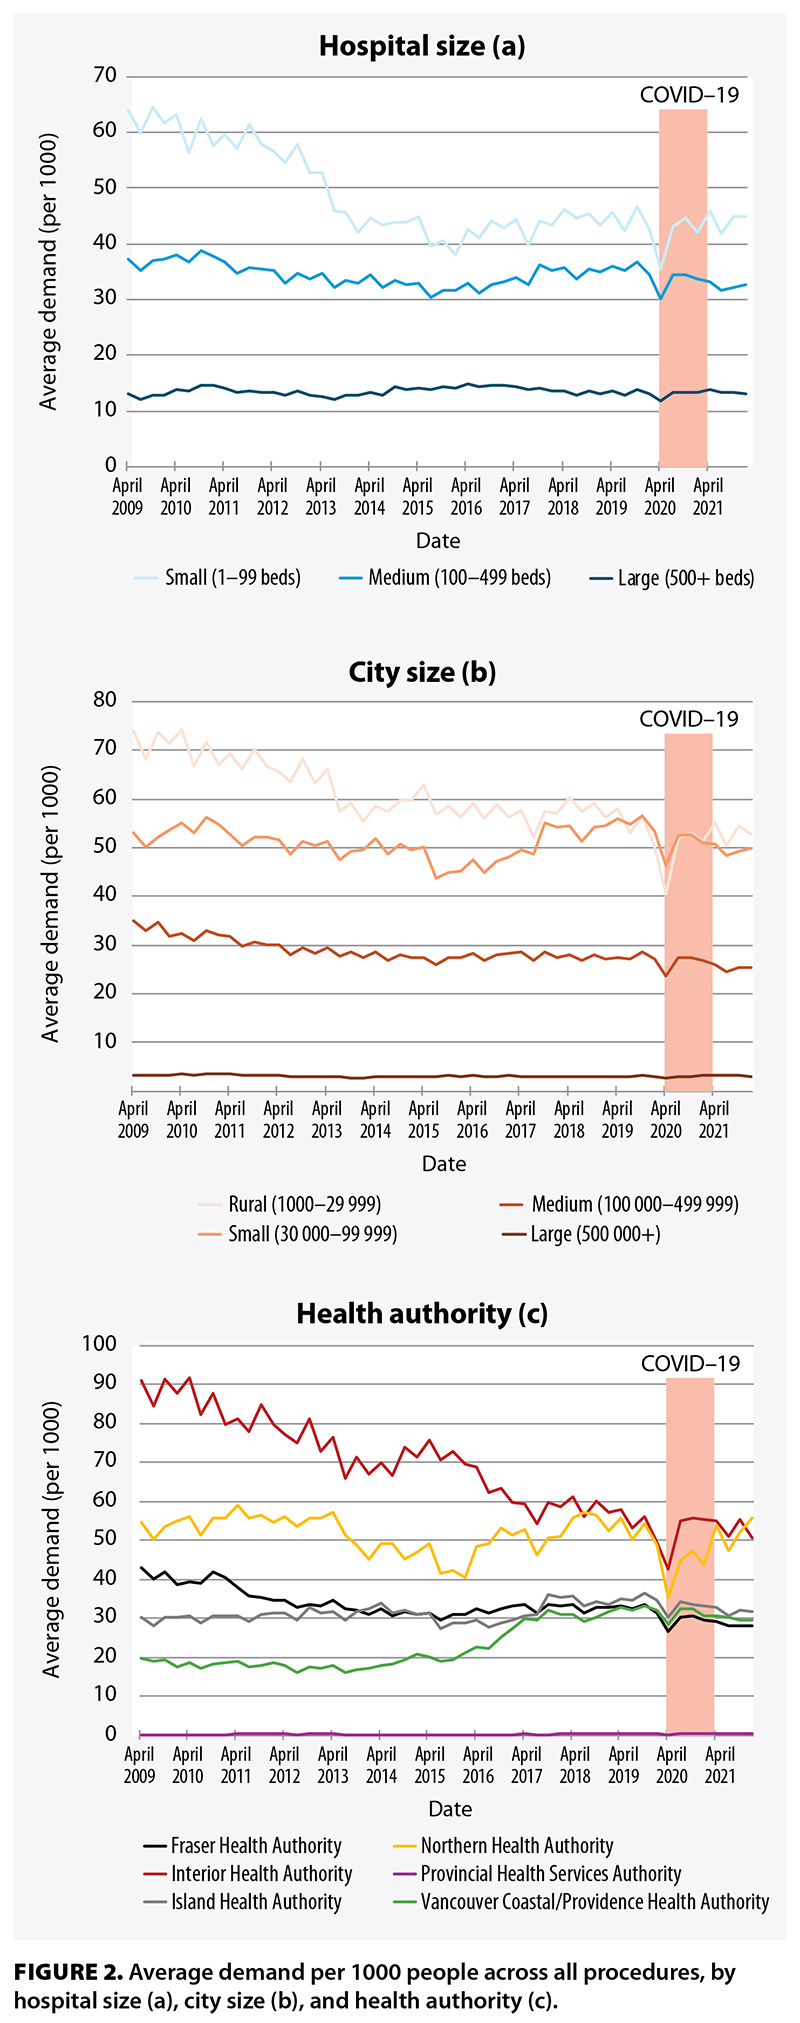
To determine whether wait times were related to the demand for surgery, average demand over time by hospital size, city size, and health authority was plotted [Figure 2].
In contrast to wait times, demand per 1000 people was highest in small hospitals and lowest in large hospitals [Figure 2a] and was highest in rural communities and lowest in large cities [Figure 2b]. While demand remained relatively constant in small, medium-sized, and large cities, it steadily declined in rural communities from 2009.
The highest demand was recorded in the Interior Health Authority, but it steadily declined from 2009 [Figure 2c]. Demand in the Fraser Health, Island Health, Northern Health, and Vancouver Coastal/Providence Health Authorities was relatively stable over time. Demand in the Provincial Health Services Authority was close to zero, given the population served is the entire province, which skewed the demand per 1000.
During the COVID pandemic, demand decreased across all categories of hospital size, city size, and health authority.
Wait times and demand by specialty
Not all hospitals have all specialties; therefore, results are reported only for hospitals that offer each procedure type.
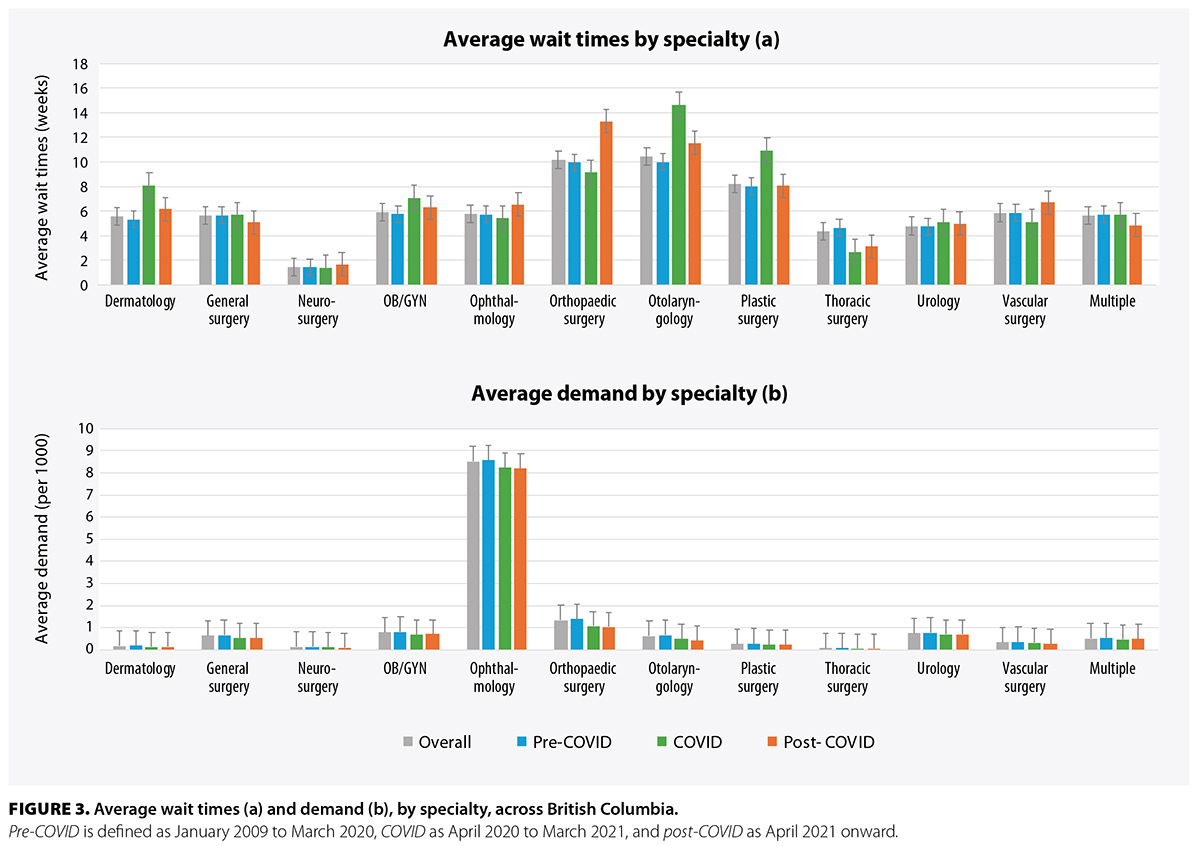 Across all specialties, otolaryngology; orthopaedic surgery; and plastic surgery had the longest wait times, while neurosurgery and thoracic surgery had the shortest [Figure 3a]. For most specialties, the error bars between the overall, pre-COVID, COVID, and post-COVID time points overlapped. However, otolarygology, dermatology, and plastic surgery showed a spike in wait times during COVID, whereas orthopaedic surgery showed a spike post-COVID.
The demand for ophthalmology was almost eightfold that of any other specialty [Figure 3b]. There was no difference in demand by time point (i.e., overall, pre-COVID, COVID, or post-COVID) for any specialty.
Discussion
In our study, medium-sized and large hospitals and small and medium-sized cities had longer wait times for surgeries relative to other hospitals and cities; small hospitals and rural communities had shorter wait times. However, small hospitals and rural communities had higher demand per 1000 people relative to other hospitals and cities; large hospitals and large cities had lower demand. Wait times for medium-sized hospitals and small cities increased during the study period, but demand remained relatively constant. There were no trends in wait times by health authority, but the Interior Health Authority had the highest demand, and the Provincial Health Services Authority had the lowest.
Although it is difficult to hypothesize about what caused these trends, the following key findings can be used to frame our results. Our analysis showed that surgical wait times in BC were not reflective of a simple supply–demand mismatch. The longest wait times often occurred in places that had the lowest demand—that is, despite a higher proportion of the patient population requiring surgery in smaller cities and hospitals compared with larger cities and hospitals, the wait times for surgery were lower in smaller hospitals. This suggests that factors beyond demand drive wait times. Our indexed measure of demand was chosen to allow comparisons between cities where raw patient numbers may vary by an order of magnitude and because hospital resources were most likely allocated in proportion to the size of the patient population served.
Despite the limitations of indexed demand, raw demand may also not completely explain the results of our analysis. A prime example of this was during COVID, when almost all analyses of the data showed spikes in wait times, with corresponding dips in demand. Because population sizes did not change meaningfully during COVID, this indicates that the declines in demand per 1000 people were driven by a reduction in raw demand, which suggests that increased wait times during the pandemic were due to non-demand-based challenges.
To hypothesize about what factors aside from demand may have caused increased wait times, we considered pre-COVID spikes in wait times. Between 2013 and 2016, large hospitals showed a prominent increase in wait times from baseline; between 2013 and 2018, wait times in large cities also increased. According to a Fraser Institute report on Canadian wait times in 2016 (the peak of the increase), this represented a nationwide trend whereby wait times were the highest ever recorded.[17] In BC, this was reflected by increases in the time from seeing a family physician to seeing a specialist and from seeing a specialist to obtaining treatment.[17] The cause of this peak was multifactorial. Notably, the time to imaging represented a significant choke point; in 2016, BC had the second-longest wait time for a CT scan (5.0 weeks versus the national average of 3.7 weeks) and the longest wait time for MRI (24.0 weeks versus the national average of 11.1) weeks.[17] Further, reports by the BC Ministry of Health and Doctors of BC acknowledged that operating room capacity was not being maximized: 18% of operating rooms were understaffed due to inadequate funding, and 23% were closed during the summer.[18] Inefficient use of operating room resources and long imaging wait times likely had a disproportionate effect on BC’s largest hospitals due to the volumes of surgery and imaging performed there. Thus, the individual resources, access, and context across different hospitals, cities, and health authorities need to be examined in more detail to account for the trends we identified.
In our study, otolaryngology, orthopaedic surgery, and plastic surgery had the longest wait times; neurosurgery and thoracic surgery had the shortest; and ophthalmology had a much higher demand than other specialties. However, this may have been due to how the procedures were divided in the database, which does not match real surgical booking and may have skewed the data, and/or how demand was calculated, which may have favored specialties with short cases and a high throughput. Our results also suggest that there was little variation in wait times by specialty before, during, and after COVID; the exceptions to this were otolaryngology and plastic surgery, which had longer wait times during COVID, and orthopaedic surgery, which had longer wait times post-COVID.
The need for surgical services has grown in BC. Between 2001 and 2018, there was a 54.4% increase in patients waiting for surgery—three times the province’s population growth in the same period.[4] This trend is anticipated to escalate with the ongoing growth and aging of the population.[1] Further, many small-volume surgical programs have closed in the last decade, which has placed further strain on existing services.[19] This can be seen in the relatively high demand for surgical services in smaller cities and hospitals. However, considering that our study shows that wait times and demand are stable or decreasing across the province, the BC health care system may be keeping pace with the increase in surgical need.
Even if wait times are largely stable, various strategies can be used to further reduce wait times. Wennberg and colleagues examined initiatives for reducing elective surgical wait times across Canada from 2000 to 2018.[20] They found that several strategies had already been implemented, such as increasing funding (either conditional or unconditional), increasing surgical infrastructure (e.g., staff, surgical units, equipment), outsourcing minor procedures to private surgical hospitals, increasing operating room efficiency (e.g., reducing time between cases, minimizing sedation use), and improving referral management systems.[20] While improvement in any of these areas could reduce wait times, the efficacy of these initiatives has not been quantified. Innovative strategies for increasing surgical efficiencies are under investigation, including using machine learning to predict procedure lengths to improve surgical bookings,[21] creating triage tools to better prioritize surgeries,[22,23] and developing just-in-time bed assignments to better manage patients postoperatively.[24] Regardless of the methods chosen, a synergistic strategy for increasing surgical capacity and improving process efficiency will be required to adequately address all underlying factors that contribute to current wait times.
Some of our findings differ from those in the literature. A 2023 report on wait lists by health authority showed decreases in wait list size in the Fraser Health Authority (23%), Island Health Authority (6%), and Vancouver Coastal Health Authority (10%), but increases in more rural regions, including the Interior Health Authority (4%) and Northern Health Authority (44%).[25] On the other hand, our study showed a decline in demand per 1000 patients in the Interior Health Authority and relatively stable demand across all other health authorities. However, we defined demand as the number of patients waiting for surgery plus the number of surgeries completed per quarter per 1000 people, whereas other reports considered total wait list volume; therefore, these disparities in results may be due to variation in definition rather than actual differences.
Study limitations
There are several limitations to our study. The BCSWT relies on self-reported data from hospital operating room booking systems, which may introduce inaccuracies. The BCSWT data are also reported on a quarterly basis, which limits granularity. Additionally, a patient’s actual wait time is often longer than what is reported, because the BCSWT registry records only the time between when a patient is added to a hospital’s surgical wait list and when they undergo surgery. In reality, wait times include time spent waiting to see a primary health care provider, acquiring additional testing, and waiting for a referral to see a surgeon. Also, procedures are grouped as “all procedures” or are divided in a way that does not necessarily reflect surgical bookings and occasionally overlap between multiple specialties (e.g., “biopsy in OR”). Additionally, our analysis compared many different types of surgeries, which can limit interpretability, because the breadth of surgical offerings and the infrastructure dedicated to each type of surgery can vary dramatically across hospitals. Finally, determining the impact of COVID was constrained by the limited availability of 1-year post-COVID data, which posed challenges in discerning meaningful trends and drawing conclusive insights.
Conclusions
Surgical wait times pose a significant challenge in BC. We analyzed changes in scheduled surgical wait times over 13 years and provided insights into the landscape of scheduled surgical procedures in BC. Identifying variations across hospital size, city size, specialty, and health authority offered insights into access to surgical care and elucidated the exacerbation of these challenges by the COVID pandemic.
Competing interests
None declared.
This article has been peer reviewed.
 |
| This work is licensed under a Creative Commons Attribution-NonCommercial-NoDerivatives 4.0 International License. |
References
1. Organisation for Economic Co-operation and Development. Waiting times for health services: Next in line. 2020. https://doi.org/10.1787/242e3c8c-en.
2. Moir M, Barua B. Comparing performance of universal health care countries, 2024. Fraser Institute, 2024. www.fraserinstitute.org/sites/default/files/2024-11/comparing-performance-of-universal-health-care-countries-2024.pdf.
3. Chan T, Hwang H, Karimuddin A. Wait times for general surgery in BC: Moving beyond measurement. BCMJ 2015;57:341-348.
4. Doctors of BC. Policy statement: Addressing challenges to surgical care. November 2022. Accessed 11 September 2024. www.doctorsofbc.ca/sites/default/files/addressing_challenges_to_surgical_care_policy_statement.pdf.
5. BC Anesthesiologists’ Society. “Far too long, far too many...”: A discussion paper on B.C.’s worrisome increase in surgical wait-times. 15 January 2019.
6. Oudhoff JP, Timmermans DRM, Knol DL, et al. Waiting for elective general surgery: Impact on health related quality of life and psychosocial consequences. BMC Public Health 2007;7:164. https://doi.org/10.1186/1471-2458-7-164.
7. Lizaur-Utrilla A, Martinez-Mendez D, Miralles-Muñoz FA, et al. Negative impact of waiting time for primary total knee arthroplasty on satisfaction and patient-reported outcome. Int Orthop 2016;40:2303-2307. https://doi.org/10.1007/s00264-016-3209-0.
8. Gagliardi AR, Yip CYY, Irish J, et al. The psychological burden of waiting for procedures and patient-centred strategies that could support the mental health of wait-listed patients and caregivers during the COVID-19 pandemic: A scoping review. Health Expect 2021;24:978-990. https://doi.org/10.1111/hex.13241.
9. Fu SJ, George EL, Maggio PM, et al. The consequences of delaying elective surgery: Surgical perspective. Ann Surg 2020;272:e79-e80. https://doi.org/10.1097/SLA.0000000000003998.
10. Moir M, Barua B. The private cost of public queues for medically necessary care, 2022. Fraser Research Bulletin. April 2022. Accessed 14 April 2025. www.fraserinstitute.org/sites/default/files/private-cost-of-public-queues-2022.pdf.
11. Samuelson-Kiraly C, Montague T, Nemis-White J, et al. Access and quality of health care in Canada: Insights from 1998 to the present. Healthc Manage Forum 2020;33:253-258. https://doi.org/10.1177/0840470420934521.
12. Vigneault LP, Diendere E, Sohier-Poirier C, et al. Acute health care among Indigenous patients in Canada: A scoping review. Int J Circumpolar Health 2021;80:1946324. https://doi.org/10.1080/22423982.2021.1946324.
13. Humber N, Dickinson P. Rural patients’ experiences accessing surgery in British Columbia. Can J Surg 2010;53:373-378.
14. Provincial Health Services Authority. BC Surgical Patient Registry. Accessed 11 September 2024. www.phsa.ca/health-professionals/professional-resources/bc-surgical-patient-registry.
15. Health Sector Information Analysis and Reporting. BC surgical wait times. Accessed 28 February 2023. https://catalogue.data.gov.bc.ca/dataset/bc-surgical-wait-times.
16. Statistics Canada. Classification of size of community. 11 March 2019. Accessed 11 September 2024. www23.statcan.gc.ca/imdb/p3VD.pl?Function=getVD&TVD=1232364&CVD=1232364&CLV=0&MLV=1&D=1&adm=0&dis=0.
17. Barua B, Ren F. Waiting your turn: Wait times for health care in Canada, 2016 report. Fraser Institute, 2016. Accessed 14 April 2025. www.fraserinstitute.org/sites/default/files/waiting-your-turn-wait-times-for-health-care-in-canada-2016.pdf.
18. Longhurst A, Cohen M, McGregor M. Reducing surgical wait times: The case for public innovation and provincial leadership. Canadian Centre for Policy Alternatives, 2016. Accessed 14 April 2025. www.policyalternatives.ca/sites/default/files/uploads/publications/BC%20Office/2016/04/CCPA-BC-Reducing-Surgical-Wait-Times.pdf.
19. Grzybowski S, Kornelsen J. The sustaining of small rural surgical services in British Columbia: A report commissioned by the Joint Standing Committee on Rural Issues. Centre for Rural Health Research, 2013.
20. Wennberg EAB, Takata JL, Urbach DR. Elective surgery wait time reduction in Canada: A synthesis of provincial initiatives. Healthc Manage Forum 2020;33:111-119. https://doi.org/10.1177/0840470419900646.
21. DelliCarpini G, Passano B, Yang J, et al. Utilization of machine learning models to more accurately predict case duration in primary total joint arthroplasty. J Arthroplasty 2025;40:1185-1191. https://doi.org/10.1016/j.arth.2024.10.100.
22. Miranda RN, Qiu F, Manoragavan R, et al. Transcatheter aortic valve implantation wait-time management: Derivation and validation of the Canadian TAVI Triage Tool (CAN3T). J Am Heart Assoc 2024;13:e033768. https://doi.org/10.1161/JAHA.123.033768.
23. Marshall DA, Bischak DP, Zaerpour F, et al. Wait time management strategies at centralized intake system for hip and knee replacement surgery: A need for a blended evidence-based and patient-centered approach. Osteoarthr Cartil Open 2022;4:100314. https://doi.org/10.1016/j.ocarto.2022.100314.
24. Braaksma A, Copenhaver MS, Zenteno AC, et al. Evaluation and implementation of a just-in-time bed-assignment strategy to reduce wait times for surgical inpatients. Health Care Manag Sci 2023;26:501-515. https://doi.org/10.1007/s10729-023-09638-3.
25. UBC Medicine Political Advocacy Committee. 86,000 and counting: Calling on the province of British Columbia to address elective surgical wait times in BC. April 2023. Accessed 14 April 2025. www.ubcmedicinepac.ca/past-campaigns/surgical-wait-times-in-bc.
Ms Hunter is a medical student in the Global Surgery Lab, Branch for Global Surgical Care, Department of Surgery, University of British Columbia. Ms Luthra is a medical student in the Global Surgery Lab, Branch for Global Surgical Care, Department of Surgery, UBC. Dr Souaiaia is an assistant professor of cell biology in the Department of Cell Biology, SUNY Downstate Health Sciences University, Brooklyn, NY. Dr Kroeker is a clinical research fellow in the Global Surgery Lab, Branch for Global Surgical Care, Department of Surgery, UBC, and a general surgery resident in the Department of General Surgery, Maimonides Medical Center, Brooklyn, NY. Dr Joos is the associate medical director and co-director of the Global Surgery Lab, Branch for Global Surgical Care, Department of Surgery, UBC, and a clinical associate professor in the Division of General Surgery, Department of Surgery, UBC. Dr Joharifard is a co-director of the Global Surgery Lab, Branch for Global Surgical Care, Department of Surgery, UBC, and a clinical associate professor in the Division of Pediatric Surgery, Department of Surgery, UBC.
Most surgical procedures have an ideal and maximum weight time. Beyond the maximal wait time morbidites and mortality usually increase. It would be useful for the authors to compare actual wait times with recommended wait times. This would provide a robust measure as to whether the health care system is appropriated funded and operationalized to meet the health care needs of our patients.