Dividing the pie into smaller slices: A qualitative and quantitative analysis of the general surgery workforce in British Columbia, 1992–2012
Issue: BCMJ,
vol. 51 , No. 1 , January February 2013 ,
Pages 26-32 Clinical Articles
Background: General surgeons play an essential role in the care of emergency, cancer, and elective surgery patients. In BC there are 4.0 general surgeons per 100000 population compared with 5.0 per 100000 in Canada and 7.1 per 100000 in the US. A growing and aging population can be expected to increase the need for general surgeons in the province.
Methods: A mixed qualitative and quantitative study was designed to determine general surgery workforce needs. In July 2012 a questionnaire was sent to all general surgeons in BC, who were asked about number of surgeons per service, amount of operating time, and wait times over a 20-year period. Surgeons were also invited to provide general comments. Results were analyzed along with data from the Canadian Institute of Health Information, BC government population projections, and information from surgical wait-list websites. The paired Wilcoxon signed rank test, student t test, and chi-square model goodness-of-fit test were employed. A P value of <.05 was considered significant.
Results: Questionnaires completed by 75 respondents indicate there were 141 general surgeons practising in BC in 1992 and 158 in 2012. BC is thus 74 surgeons short of meeting the Canadian average, with a further 28 surgeons needed by 2022. A significant majority of respondents (65%) described an immediate need to recruit but an inability to do so because of insufficient hospital resources. Operating days per month per full-time-equivalent surgeon significantly decreased from 5.6 days (95% CI, 5.2–5.9) in 1992 to 4.6 days (95% CI, 4.3–5.0) in 2012 (P=.011). Wait times increased by 54% between 1992 and 2012; this meant an increase from 2.8 months (95% CI, 2.2–3.3) to 3.8 months (95% CI, 3.5–4.1) for cholecystectomy, 3.5 months (95% CI, 2.8–3.9) to 4.5 months (95% CI, 4.2–4.7) for inguinal hernia, 1.3 months (95% CI, 0.6–1.9) to 2.3 months (95% CI, 2.1–2.6) for bowel resection, and 3.0 months (95% CI, 0.7–3.7) to 5.2 months (95% CI, 5.0–5.5) for colonoscopy. The majority of respondent comments expressed frustration with lack of resources, increased workload, increased volume of cancer cases, more bureaucracy, and longer wait times.
Conclusions: The number of general surgeons per 100000 population in BC since 1992, the general surgery workforce, and operating room resources have not increased as needed. In 2012 only 68.9% of general surgery cases met wait-time targets. In the face of an aging population that will require more surgical care for common cancers, especially colorectal and breast cancer, appropriate resources must be provided to recruit an adequate number of general surgeons to meet growing needs.
Survey results demonstrate the need for more general surgery resources throughout the province to address the increasing burden of illness we can expect with a growing and aging population.
Background
General surgeons play an essential role in both urban and rural settings in British Columbia. In urban settings, they perform procedures such as liver transplants and oncology and colorectal surgeries. In rural settings, general surgeons provide services that are vital to the function of a general hospital: endoscopy, emergency abdominal surgery, breast and colorectal cancer surgery, and care of trauma patients. Without a general surgery service, many patients would have to leave their local rural hospital for the most routine surgical care.
The average number of general surgeons in Canada is 5.0 per 100 000 people.[1] In BC we currently have 4.0 general surgeons for every 100 000 people and the number has been as low as 3.3 in 2002.[1] The United States has 7.1 general surgeons per 100 000 people, which is much closer to the ideal number needed to ensure access to timely high-quality care, 7.53.[2] Many recent articles predict a critical shortage of general surgeons in the US as a result of population growth and aging, particularly in rural settings.[3-8] Other contributing factors are a fixed number of training positions despite population growth, a decrease in interest in general surgery as a career choice,[9] and an increase in the number of general surgery residents who pursue fellowship training but then do not end up practising general surgery.
In Canada and in BC, the growing and rapidly aging population means an increased demand for general surgical services. In a model incorporating data for the aging population of Manitoba, which expects a population increase of 13% by 2020, a need for 27% more general surgeons was identified.[10] The population of BC grew by 33.8% from 1992 to 2012 and is projected to grow another 12% between 2012 and 2022. The population of those aged 65 or older grew by 66% between 1992 and 2012 and is projected to grow another 42% by 2022.[11] By 2022, 20% of the BC population will be 65 or older.
Considering that BC already lags behind the rest of Canada in terms of the number of general surgeons practising here, it is imperative to examine the causes for this, to determine surgical needs for the next decade, and to develop ways to address the surgeon shortfall.
Methods
A study was designed to determine changes in the number of general surgeons in BC, the length of wait times over the past 20 years, the resources currently available, and the population increases expected. In July 2012 an electronic questionnaire was sent to all general surgeons in British Columbia, a total of 178, in an attempt to obtain at least 70 responses and thus collect data from a representative cross-section of the general surgeons in the province. Follow-up interviews were conducted by fax, phone, and e-mail.
Surgeons were asked to recall the number of surgeons working at each of their hospitals providing surgical services between 1992 and 2012. They were also asked to recall the number of operating days available to each general surgery service in an average month, as well as the average wait times for four index procedures. These data were recorded in a Microsoft Excel 2010 spreadsheet. Surgeons were also allowed to provide general comments.
The data on the number of surgeons in BC were compared with data from the Canadian Institute for Health Information (CIHI),[1] and relevant population projections from BC Stats.[10] Wait-list information provided by respondents was compared with BC surgical wait times data.[12] General comments were read and analyzed.
Continuous variables were compared using the paired Wilcoxon signed rank test or t test, where appropriate. Predictive comparisons were made using the chi-square model goodness-of-fit test. Statistics were calculated with an online statistical calculator.[13] A probability value of P < .05 was considered significant.
Results
Figure 1 shows the number of general surgeons in BC as determined by the survey results compared with the number needed to meet the Canadian average of 5.0 per 100 000 population.[1,11] There are currently 158 full-time-equivalent (FTE) general surgeons in BC. To match the Canadian average, there should be 232 general surgeons in BC, which has a population of 4 639 577. The number of general surgeons needed in 2022 in BC to serve a projected population of 5190802 is 260.[11]
All five BC health regions were represented in the 75 responses received from 34 hospitals. Sixty-four respondents (85%) indicated they worked full time as general surgeons. Six respondents (8%) indicated they worked part time, three (3%) indicated they worked part time as vascular, thoracic, or pediatric surgeons, one (1%) performed only surgical assists, and two respondents (3%) were fully retired.
When asked about recruitment at their hospitals, 71 surgeons responded. Forty-six respondents (65%) indicated they have an immediate need to recruit but are prevented from doing so by lack of operating room time, endoscopy time, or both. Nineteen (26%) indicated they are not recruiting and have no need. Four (6%) indicated they have a need but there is a lack of suitable candidates. Two (3%) indicated they recently recruited and now have no need.
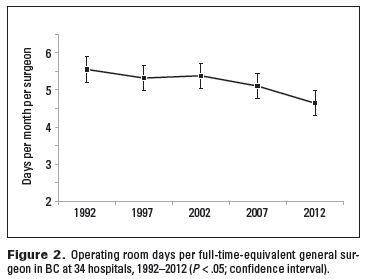
When taking into account the 34% population increase from 1992 to 2012, the mean number of operating days per month in each hospital should have increased from 18.8 days to 25.1 days. The actual number in 2012 was significantly lower at 18.6 days P < .0001). Figure 2 shows the mean number of OR days per FTE surgeon based on responses from 34 hospitals where data were available for the entire period. The mean number of OR days per month decreased from 5.6 days (95% CI, 5.2–5.9) in 1992 to 4.6 days (95% CI, 4.3–5.0) in 2012 (P = .011). The number of OR days in 2012 was significantly less than in all other time periods.
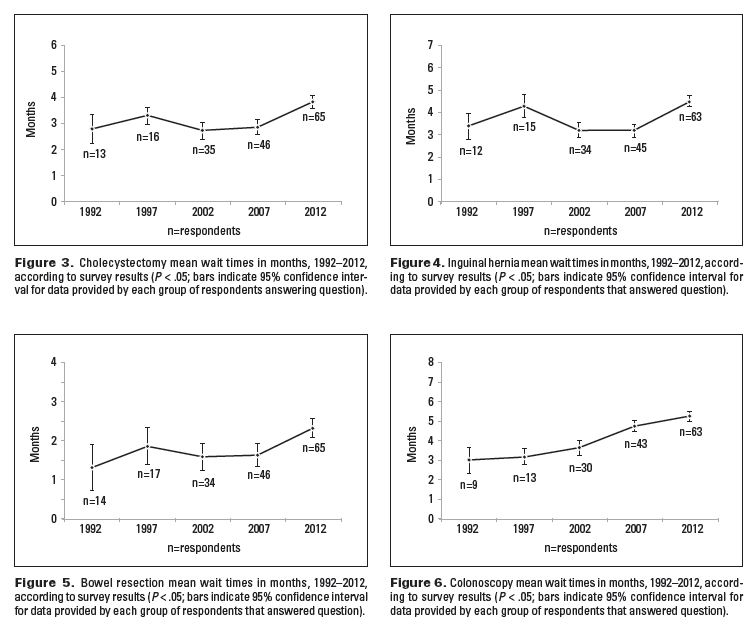
Figures 3-6 show the mean wait times in months for four procedures: cholecystectomy, inguinal hernia, bowel resection, and colonoscopy. Comparisons between time periods were conducted only if data were available. Depending on the procedure, 9 to 14 respondents provided data for the entire 20-year period, while 63 to 65 respondents provided data for current wait times.
Wait times in 2012 were significantly longer than in other periods. Between 1992 and 2012, the wait time for cholecystectomy increased 37% from 2.8 months (95% CI, 2.2–3.3) to 3.8 months (95% CI, 3.5–4.1), inguinal hernia wait time increased 27% from 3.5 months (95% CI, 2.8–3.9) to 4.5 months (95% CI, 4.2–4.7), bowel resection wait time increased 77% from 1.3 months (95% CI, 0.6–1.9) to 2.3 months (95% CI, 2.1–2.6), and colonoscopy wait time increased 74% from 3.0 months (95% CI, 0.7–3.7) to 5.2 months (95% CI, 5.0–5.5). Overall, there was a 54% increase in wait times.
Table 1[12,14–17] compares the wait times in BC, broken down by health authority, with wait times in four other provinces that report data in a similar fashion. When comparing wait times for four common procedures, BC or one of its health authorities has the longest wait times, with only one exception, intestinal surgery in Alberta. The surgical wait times reported on the BC Ministry of Health website[12] are in keeping with the findings in our study, although the website reports the number of weeks where 90% of patients have received their surgery rather than the mean wait times, which are not directly comparable.
Thirty-nine surgeons (52%) responded to the open-ended question “Please share any comments you have about your workload, waitlist, access to resources and recruitment over time.”
Many made several comments. On the whole, the majority of comments were negative or pessimistic in nature. Nine respondents commented that operating room time is inadequate and does not meet increasing demands. Seven respondents noted that a higher cancer workload and fixed operating room time have resulted in longer wait times for noncancer cases. Six remarked on an increasing workload in general. Five mentioned longer wait times for cancer patients due to lack of resources. Six mentioned long wait times for endoscopy. Five remarked on frustration with bureaucracy.
In addition, three respondents mentioned lengthening wait times from GP referral to office consult, and three respondents said long wait lists have altered local referral patterns, prompting GPs to send patients to neighboring communities. Two respondents described losing OR time to other surgical specialties over time. One respondent suggested that patient care is being compromised as a result of long wait lists.
One respondent had no issues with wait lists or resources. One comment suggested that diminishing surgical workload is making practice in small rural communities nonviable.
Limitations
The authors acknowledge the study’s main limitation: the need to assume that the data obtained from the respondents reflect the experience of those surgeons who did not respond to the survey. Nevertheless, we did receive responses from all health regions, and we did exceed our goal of 70 responses, a number deemed adequate to ensure a representative cross-section of general surgeons in BC.
Conclusions
Provision of surgical care in BC is complex, poorly studied, and poorly planned. This is increasingly so for general surgery. According to 65% of respondents, the number one factor preventing the recruitment of general surgeons in BC is lack of operating room and endoscopy time. One respondent’s remark summarizes the situation: “Every month we struggle to find OR time for our cancer cases… only doing elective noncancer cases if there are open time slots left. Due to this issue, recruitment is also at a standstill.”
This study demonstrates that although there was a slight increase in the number of FTE general surgeons from 143 in 1992 to 158 in 2012, operating room time did not increase accordingly and the result was a significant net loss of OR time per FTE surgeon. The direct results are significant increases in wait times in four index procedures. CIHI reported that 198 general surgeons were practising in BC in 2009/10 and performing the work of 176.76 FTE surgeons.[1] This is clearly an overestimation of the effective number, as many individuals (15% according to our survey) work as locums, perform only surgical assists, or work part time. Without providing adequate OR and endoscopy time to keep up with population growth and aging, increasing the number of general surgeons serves little purpose. Such an approach simply divides the same pie into smaller slices and undermines our ability to deal with an increasing burden of illness.
The CIHI and the Romanow report have estimated that health costs for those aged 65 and older are between three and four times higher than that for the general population.[1,18] One major reason for higher health care costs is the greater incidence of cancer in the elderly. Although there are regional variations in incidence rates of cancer, by far the greatest risk factor for cancer is increasing age.[19] After age 60 the incidence rate for breast cancer increases from 50 per 100 000 to 350 per 100 000. For colorectal cancer, the rate increases from 45 per 100 000 to 400 per 100 000 after age 60.[19]
The increase in cancer incidence has a significant impact on general surgeons, who are involved in the diagnosis or treatment of 9 of the 16 most common cancers: breast, colorectal, lymphoma, thyroid, melanoma, pancreas, stomach, liver, and esophagus. The number of new cases per year for all of these cancers is increasing.[19] Each year in Canada there are 26 500 new cases of prostate cancer, 25 600 new cases of lung cancer, 23 300 new cases of colorectal cancer, and 22 900 new cases of breast cancer.[19]
Prostate and lung cancer require resection in only 10% of cases, compared with colorectal and breast cancer, which require resection in 67% (colorectal) and 84% (breast) of cases.[20] Figure 7 shows the historical and projected number of cancer surgeries for the four most common cancers.[19-21]
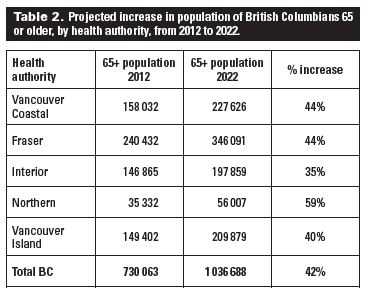
The gross population growth in BC between 2012 and 2022 is expected to be 12%, while the projected increase in the number of cancer surgeries is 34%. This imbalance mirrors the findings of Katz and colleagues,[10] who predict that a gross population increase of 13% would require 27% more general surgeons. Table 2[11] shows the projected increase in the 65 and older population by health authority.
Based on incidence rates by 5-year age cohorts and population projections for an additional 325 000 people older than 65 by 2022, we can expect an additional 634 cases of breast cancer and 726 cases of colorectal cancer per year.[21] This represents roughly 2720 hours of additional cancer surgery per year or seven full operating room days per week across BC greater than what is currently available.
The result of inadequate operating room time to date has been growing wait lists and longer wait times. Patients with cancer are being pushed to the front of the queue to the detriment of the “walking wounded”—patients without a life-threatening diagnosis who are forced to function with pain and disability. One survey respondent wrote, “We would not have been able to recruit without sacrificing OR time to accommodate the new surgeon! Call is much busier than it used to be and complex cancer cases make up the bulk of the work. [Hernia and gallbladder cases] wait a long time and often show up in the ER.”
BC compares unfavorably with the other provinces for general surgery procedures.[12,14-17] According to the provincial Surgical Patient Registry, only 68.9% of general surgery cases handled between January and August 2012 were completed within the target wait times (e-mail communication with Erdem Yanganolu, MD, Manager, BC Surgical Patient Registry, 28 August 2012). Cancer cases were marginally better at 77.3%. Certainly, there is room for improvement.
A priority-setting scoring system, which is essentially a triage tool for scheduling patients on wait lists,[22,23] does not solve the problem because it cannot address the fundamental shortage of operating room time. Another respondent made an insightful comment: “There is a global need for more OR time at our institution. We have just started using the [resource allocation management] methodology but it only allocates based on the OR time we currently have and redistributes it between surgeons. There will be no new OR time created so the overall shortage will continue.”
BC currently has 158 full-time-equivalent general surgeons instead of the 232 it needs to equal the Canadian average of 5 per 100 000 population, a shortfall of 74. As shown in Table 3, by 2022 the need will grow to 260 surgeons to keep up with population growth. If we factor in the aging of BC’s population, the need will be even greater. Ironically, despite the shortage of general surgeons, growing wait lists, and obvious demographic challenges in BC, some surgeons are unable to find jobs. The effect of a growing and aging population on the demand for surgical services needs to be acknowledged and studied further. Provincial and federal governments and regional health authorities must develop concrete plans to provide adequate resources, specifically increased access to operating rooms and endoscopy suites, before we will be able to recruit appropriate numbers of general surgeons to meet the increasing demands for cancer surgery and other general surgical services.
Competing interests
None declared.
References
1. Canadian Institute for Health Information. 2012. Accessed 8 December 2012. www.cihi.ca.
2. Williams TE Jr, Ellison EC. Population analysis predicts a future critical shortage of general surgeons. Surgery 2008;144:548-556.
3. Lynge DC, Larson EH, Thompson MJ, et al. A longitudinal analysis of the general surgery workforce in the United States, 1981-2005. Arch Surg 2008;143:345-350.
4. Lynge DC, Larson EH. Workforce issues in rural surgery. Surg Clin N Am 2009;89:1285-1291.
5. Sheldon GF. Workforce issues in general surgery. Am Surg 2007;73:101-108.
6. Richardson JD. General surgeon shortage in the United States: Fact or fiction, causes and consequences. Soc Work Pub Health 2011;26:513-523.
7. Etzioni DA, Finlayson SR, Ricketts TC, et al. Getting the science right on the surgeon workforce issue. Arch Surg 2011;146:381-384.
8. Williams TE Jr, Satiani B, Ellison EC. A comparison of future recruitment needs in urban and rural hospitals: The rural imperative. Surgery 2011;150:617-625.
9. Marschall JG, Karimuddin AA. Decline in popularity of general surgery as a career choice in North America: Review of postgraduate residency training selection in Canada, 1996-2001. World J Surg 2003;27:249-252
10. Katz A, Bogdanovic B, Ekuma O, et al. Physician resource projection models. Winnipeg, MB: Manitoba Centre for Health Policy: 2009;43-50.
11. BC Stats. Population projections. June 2012. Accessed 8 December 2012. www.bcstats.gov.bc.ca/StatisticsBySubject/Demography/PopulationProjections.aspx12.
12. British Columbia Ministry of Health. Surgical wait times. Accessed 8 December 2012. www.health.gov.bc.ca/swt/.
13. Statistics Online Computational Resource. Accessed 7 November 2012. www.socr.ucla.edu/SOCR.html.
14. Ontario Ministry of Health and Long-term Care. Ontario wait times. Accessed 8 December 2012. www.health.gov.on.ca/en/public/programs/waittimes/.
15. Government of Alberta. Alberta wait times reporting.Accessed 8 December 2012. http://waittimes.alberta.ca.
16. Government of New Brunswick. Surgical wait time in New Brunswick. Accessed 8 December 2012. www1.gnb.ca/0217/SurgicalWaitTimes.
17. Government of Nova Scotia. Nova Scotia’s wait times. Accessed 8 December 2012. http://gov.ns.ca/health/waittimes/.
18. Romanow RJ. Building on values: The future of health care in Canada. Ottawa, ON: Commission on the Future of Health Care in Canada; 2002.
19. Canadian Cancer Society, Provincial/Territorial Cancer Registries, Public Health Agency of Canada. Canadian cancer statistics 2012. Accessed 7 November 2012. www.cancer.ca/Canada-wide/About%20cancer/Cancer%20statistics.aspx?sc_lang=en.
20. National Cancer Intelligence Network. Major surgical resections: England, 2004–2006. Accessed 7 November 2012. www.ncin.org.uk. (See: NHS treated cancer patients receiving major surgical resections.)
21. Navaneelan T, Janz T. Cancer in Canada: Focus on lung, colorectal, breast and prostate. Statistics Canada Catalogue no. 82-624-X. Accessed 7 November 2012. www.statcan.gc.ca/pub/82-624-x/2011001/article/11596-eng.htm.
22. Noseworthy TW, McGurran JJ, Hadorn DC. Waiting for scheduled services in Canada: Development of priority-setting scoring systems. J Eval Clin Pract 2002;9:23-31.
23. Taylor MC, Hadorn DC. Developing priority criteria for general surgery: Results from the Western Canadian Waiting List Project. Can J Surg 2002;45:351-357.
Dr Hwang is a general surgeon at Vernon Jubilee Hospital and a clinical instructor in the Faculty of Medicine at the University of British Columbia. Dr Karimuddin is a general and colorectal surgeon at St. Paul’s Hospital in Vancouver and a clinical instructor in the Faculty of Medicine at UBC. He is also president of the BCMA Section of General Surgery.
