Insulin therapy is no cheaper than thiazolidinedione therapy in patients with type 2 diabetes
Issue: BCMJ,
vol. 48, No. 8, October 2006,
Pages 392-398 Clinical Articles
Background: Patients with uncontrolled type 2 diabetes who are on maximum doses of oral hypoglycemic agents have the option of initiating either thiazolidinedione or insulin therapy. Our primary goal was to determine if there are any cost differences associated with these two therapies.
Methods: At the Diabetes Centre at St. Paul’s Hospital, we compared patients with type 2 diabetes who were on thiazolidinedione therapy (n = 464) and insulin therapy (n = 382). To estimate the cost of each therapy, we considered expenses for home blood glucose monitoring, thiazolidinedione use, insulin use, and an outpatient clinic to initiate insulin therapy.
Results: During the first year of therapy, thiazolidinedione costs ($1389.78) were considerably lower than insulin costs ($1959.25). After 3 years, cumulative costs for both therapies were similar (thiazolidinedione = $4185.82, insulin = $4286.19).
Conclusions: In year 1 thiazolidinedione therapy involves fewer costs than insulin therapy, and in years 2 and 3 the costs of the two therapies are comparable.
When comparing insulin therapy with thiazolidinedione therapy, all of the expenses related to each medication need to be considered, including the cost of blood glucose monitoring strips and clinic services.
Diabetes mellitus is a chronic metabolic disease affecting more than 2 million Canadians, and its prevalence is expected to rise to 3 million by the year 2010.[1] Approximately 85% to 90% of individuals with diabetes have type 2 diabetes, characterized by insulin resistance and progressive pancreatic beta cell dysfunction.[1,2] Although glycemic goals may initially be achieved through diet and exercise, over 80% of patients with type 2 diabetes eventually require pharmacological therapy.[3,4]
The United Kingdom Prospective Diabetes Study (UKPDS), the largest and longest randomized controlled trial for type 2 diabetes to date, demonstrated a significant continuous relationship between lowering blood glucose levels and the reduction of long-term microvascular complications (e.g., retinopathy, nephropathy, and possibly neuropathy).[5] Results indicated that for every percentage decrease in hemoglobin A1c levels (e.g., 9% to 8%), the risk of developing microvascular complications decreased by 37%. Results also indicated a nonsignificant relationship between improved glycemic control and a reduced incidence of cardiovascular disease.[6]
Given the health benefits of improved glycemic control, the goal of therapy in patients with type 2 diabetes is to attain hemoglobin A1c levels within the normal range (≤7.0%).[7] The Canadian Diabetes Association’s 2003 clinical practice guidelines recommend that antihyperglycemic agents should be initiated if lifestyle management fails to achieve glycemic goals within the first 2 or 3 months of diagnosis.[8] Generally, patients are placed on a biguanide (e.g., metformin) alone or in combination with an antihyperglycemic agent from a different class, such as a sulfonylurea (e.g., glyburide). If maximum doses of biguanides and sulfonylureas cannot effectively reduce glycemic levels, then a patient may be placed on either a combination of biguanides, sulfonylureas, and insulin, or a combination of biguanides, sulfonylureas, and thiazolidinediones (TZDs). The Canadian Diabetes Association’s guidelines recommend that insulin may also be used as a first-line therapy for patients with marked hyperglycemia (≥9.0%).[8]
TZDs are a unique class of oral antidiabetic agents. The two second-generation TZDs, pioglitazone (Actos) and rosiglitazone (Avandia), have been available in Canada since August 2000 and March 2003, respectively. TZDs enhance insulin sensitivity in the liver and peripheral tissues (muscle and adipose) by activating peroxisome proliferators-activated receptors.[9-11] Research also suggests that TZDs decelerate the rate of beta cell dysfunction and loss.[12,13]
The efficacy of TZDs is well established. Numerous studies have demonstrated that TZDs significantly decrease A1c levels in monotherapy[14-17] and in combination with biguanides and/or sulfonylureas.[15,18,19] Additionally, TZDs have been shown to improve plasma lipid profiles.[15]
The short-term safety of TZDs has also been well documented. Common mild adverse effects include fluid retention and weight gain.[15,16,18,19] As TZDs do not stimulate pancreatic beta cell insulin secretion, they have been associated with a low risk of hypoglycemic episodes.[20,21] In contrast, as sulfonylureas and insulin therapy increase circulating levels of insulin, they have been associated with a significantly higher risk of hypoglycemia.[22] In a study conducted over 6 months with 1055 participants, the prevalence of hypoglycemic episodes in patients using insulin therapy was nearly twice that of patients using oral hypoglycemic agents (30% versus 16%).[23]
The economic burden of diabetes and its complications is immense. Brandle and colleagues revealed that median direct medical expenditures for patients with type 2 diabetes ranged from US$1684 to US$10 500.[24] Patients with diabetes have been shown to have medical costs 2.4 times greater than if they had not developed diabetes.[25] In one study, lifetime costs of diabetes complications were estimated to be US$47 240 per patient with type 2 diabetes,[26] and an American Diabetes Association study estimated direct medical expenditures associated with diabetes in 2002 to be $92 billion.[27]
If a patient uses maximum doses of oral medications, has A1c levels outside glycemic goals, and appears unable to afford TZDs, it is likely that he or she will subsequently be placed on insulin therapy. However, no study to date has assessed the financial ramifications of this decision. Thus, the current study was undertaken to compare the annual cost of placing a patient on TZD therapy versus insulin therapy. A secondary goal was to compare the safety and efficacy of the two therapies.
The study involved a review of data from patients with type 2 diabetes who attended and returned to the Diabetes Centre located at St Paul’s Hospital in Vancouver, British Columbia. Patients are referred to the centre by their family physicians, and 99% of referred patients are seen by an endocrinologist during their visit. Since 1984, clinical parameters from all patient visits have been recorded in a database.
Each time patients visit the centre, they are assessed for daily medication dosage, weekly frequency of home blood glucose monitoring, hemoglobin A1c, weight, and hypoglycemia. Weekly frequency of home blood glucose monitoring is self-reported by patients. A1c levels are measured using ion-exchange high-performance liquid chromatography (Diamet analyzer, Bio-Rad Laboratories, Hercules, California). Additionally, Vacutainer tubes containing ethylenediaminetetraacetic acid (EDTA) are used to collect the blood specimens. At each visit, patients indicate the number of times they have experienced hypoglycemia in the previous month. A hypoglycemic episode is defined as an instance in which a patient experienced low blood sugar, as indicated by a blood glucose test or appropriate symptoms.
Information gathered at each patient visit is recorded in the centre’s database. We used this database to identify all visits to the centre between May 1993 and September 2004. We then identified all patients who were on either TZD therapy but not insulin therapy (n = 464) or on insulin therapy but not TZD therapy (n = 382) during this time. Ultimately, the study population included all patients who were ever started on TZD therapy at our centre, and a comparable number of patients started on insulin. To be included in the study, a patient needed to have a record of a baseline visit (i.e., one session before TZD therapy or insulin therapy was initiated) and at least one follow-up visit.
Yearly costs of TZD therapy were estimated by first using the database to determine (1) daily TZD dosage for each patient and (2) number of blood glucose monitoring strips utilized per week by each patient. Individual values for each year were averaged among all patients on TZD therapy and local pharmacy price lists were than used to estimate the average annual cost for each patient of TZDs and blood glucose monitoring strips.
Yearly costs of insulin therapy were estimated by first using the database to determine (1) total number of units of insulin utilized per day (both short- and long-acting) and (2) number of blood glucose monitoring strips utilized per week. From this, we calculated the average number of penfil boxes and blood glucose monitoring strips utilized per year by each patient. We then used local pharmacy price lists to estimate the average annual cost for each patient of penfils of insulin and blood glucose monitoring strips. Although some patients did utilize more expensive insulin analogs, estimates were based on the cost of penfils of 30/70 insulin. Penfils rather than vials of insulin were used in our calculations because the majority of our patients (83%) utilize these. The cost of a 4-day clinic was also incorporated in the year 1 cost analysis for insulin therapy because patients who initiate insulin therapy at the centre attend this clinic in order to optimize insulin dosage and learn insulin administration techniques. This initial instruction is not necessary when TZD therapy is initiated.
Costs of the follow-up visits in years 1, 2, and 3 were not included in the cost analysis for either therapy, as the number of follow-up visits per year was similar for both groups. All costs were calculated in Canadian dollars.
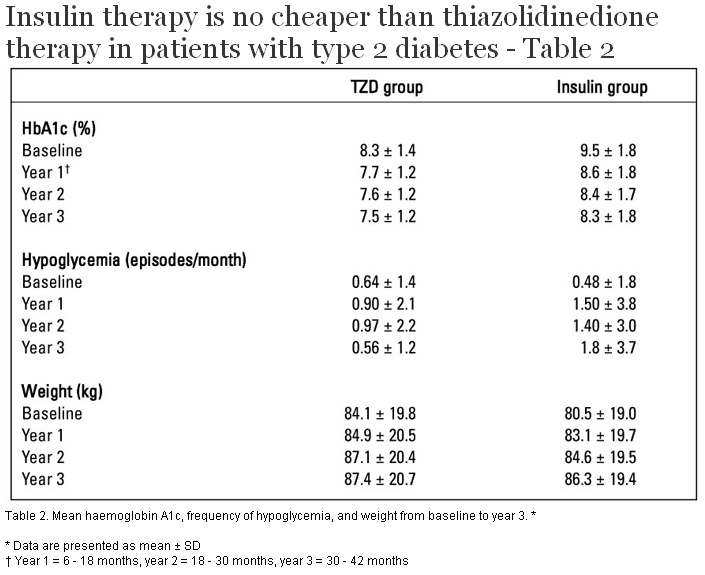
To determine the safety and efficacy of each therapy, we assessed A1c, weight, and monthly frequency of hypoglycemia annually up to 3 years (year 1 = 6 to 18 months, year 2 = 18 to 30 months, year 3 = 30 to 42 months) following the patient’s baseline visit.
The data for the variables used to assess safety and efficacy were presented as mean ±SD. Within each of the two therapy groups (TZD and insulin), a paired t-test was used to test if A1c, weight, and frequency of hypoglycemic episodes changed compared with baseline. Between the two therapy groups, a two-sample t-test was used to compare the mean change of each of the three variables since baseline at years 1, 2, and 3. Analyzing change since baseline data at each follow-up allowed us to control for the difference in baseline levels between different patients and between therapy groups. Statistical significance was established at P < .05.
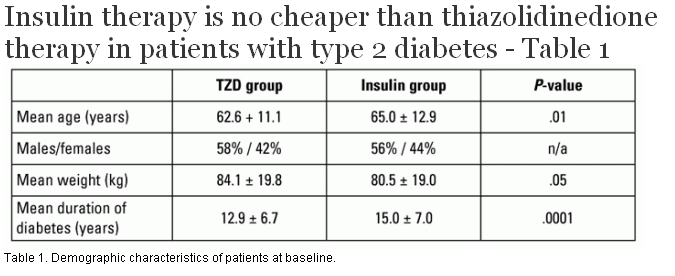
The key demographic characteristics of patients at baseline are summarized in Table 1. At baseline, 95% of patients on TZDs were on a combination therapy (e.g., metformin and/or sulfonylureas).
Because the study was conducted over a 3-year period, some patients were not able to complete all follow-ups. Within the insulin group (n = 382), 19% of patients did not return for all 3 years of follow-up, and 3% of patients were taken off insulin during the follow-up period. Within the TZD group (n = 464), 23% of patients did not return for all 3 years of follow-up, 2% of patients eventually had insulin added to their therapy, and 14% of patients were taken off TZDs during the follow-up period when they developed side effects such as fluid retention or edema and 11% for other reasons.
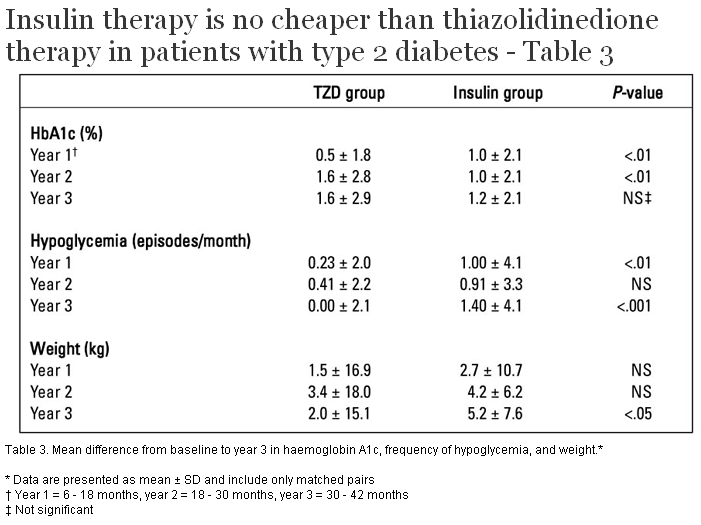
Mean A1c levels, frequency of hypoglycemia, and weight at baseline and at years 1, 2, and 3 are presented for both groups in Table 2. The mean changes in each parameter from baseline (using matched pair data) at year 1, 2, and 3 are presented in Table 3.
Within each of the two therapy groups, results showed statistically significant mean decrements in A1c values every follow-up year compared with baseline (P < .0001).
Within the TZD group, mean change in hypoglycemic episodes from baseline was not significantly different than zero at follow-up years 1 and 3. However, during year 2 the mean change from baseline was significantly more positive than zero, suggesting that the frequency of hypoglycemia increased throughout the second year of therapy. At baseline, 77% of patients on TZDs (358) were also on sulfonylurea therapy, which may be responsible for incidences of hypoglycemia. The proportion of patients on this therapy remained fairly constant throughout years 1 (76%), 2 (78%), and 3 (76%). Within the insulin group, mean change in hypoglycemic episodes from baseline was significantly more positive than zero at every follow-up, indicating that hypoglycemia was more frequent than baseline throughout the entire 3-year period.
Within the TZD group, mean weight change from baseline did not significantly differ from zero at follow-up years 1 and 3. However, during year 2 the mean weight change from baseline was significantly more positive than zero, suggesting that weight increased over the 2-year period. Within the insulin therapy group, mean weight change from baseline was significantly more positive than zero at every follow-up, indicating that weight increased over the 3-year period (P < .0001).
Between therapy groups, mean change in A1c from baseline was significantly different at follow-up years 1 and 2 (P < .01). Mean change at year 1 was more negative for the insulin group, whereas mean change at year 2 was more negative for the TZD group. There was no significant difference at follow-up in year 3.
Between therapy groups, mean change in frequency of hypoglycemia from baseline differed significantly at follow-up years 1 (P < .01) and 3 (P < .001), and also differed at year 2, but not significantly (P = .06). The insulin group always had a greater mean increase in the frequency of hypoglycemic episodes compared with the TZD group.
Between therapy groups, mean change in weight from baseline did not significantly differ at follow-up years 1 and 2. However, during year 3 the mean change in weight from baseline was significantly more positive for the insulin group (P < .05).
The cost of TZD therapy versus insulin therapy is presented in Table 4 . To calculate the average annual cost of blood glucose monitoring strips for each therapy in year 1 (insulin = $599.25, TZD = $344.34) we multiplied the cost per strip ($0.86) by the average number of strips utilized by each patient (insulin patient = 696.8, TZD patient = 400.4). The same procedure was used for years 2 and 3. We calculated the average annual cost of TZD use in year 1 ($1045.44) by multiplying the proportion of patients on each daily dose of medications (pioglitazone 15 mg, 30 mg, or 45 mg; rosiglitazone 2 mg, 4 mg, 8 mg, or 16 mg) by the annual cost of each dose, and subsequently totalled these costs. The same procedure was used for years 2 and 3. We calculated the average annual cost of insulin use in year 1 ($600) by multiplying the average number of penfil boxes used per year (12) by the cost per box ($50). The same procedure was used for years 2 and 3.
To calculate the cost of a 4-day instructional clinic that patients attended after initiating insulin therapy, we divided our centre’s annual budget by the number of patient visits per year. Because the 4-day educational program is equivalent to four individual visits to the centre, we multiplied the cost of one visit ($140) by 4 to get $560. This value represents the cost of all clinic services, with the exception of the meetings that each patient has with an endocrinologist. We added an additional $200 per patient to account for this, meaning a total cost of $760 for the entire 4-day program.
When we totalled all costs, we found the average cost of initiating insulin therapy in year 1 using penfils of insulin was $1959.25. In contrast, the average cost of initiating TZDs in year 1 was $1389.78. The average cost of maintaining insulin therapy throughout years 2 and 3 using penfils of insulin was $1163.47 per year, whereas the cost of maintaining TZD therapy was $1398.02 per year. After 3 years, the cumulative cost of TZD therapy was $4185.82, while the cumulative cost of insulin therapy was $4286.19.
In line with previous studies, our study demonstrated that TZDs significantly improve A1c levels at follow-up when compared with baseline.[15-21] Over the 3-year period of the study, our results revealed an absolute reduction in A1c of 0.8%. These findings are similar to those in Grossman’s review article of pioglitazone, whereby absolute reductions in A1c ranged from 0.8% to 2.6%.[28] Although 14% of patients were taken off TZD therapy during this follow-up period (3% because of side effects) and 2% eventually had insulin added to their regimens, our results indicate that in the majority of people (84%) who are prescribed TZD medications, the therapy can be maintained with continued efficacy over 3 years of follow-up. This is shown in the recent PROactive study that followed 244 patients after pioglitazone was initiated and found that only 11% of patients started on pioglitazone needed to permanently switch to insulin therapy within 36 months.[29] Similarly, our study found that TZD therapy provided long-term support for 216 patients over 3 years and that the beneficial glycemic effects of TZDs do not deteriorate significantly over time.
Upon directly comparing A1c reductions in each therapy group, we found that although the year 1 mean change in A1c was significantly lower in the insulin group, the year 2 mean change in A1c was significantly lower in the TZD group. At year 3, the mean change in A1c level was not significantly different between the two groups. While insulin therapy results in a greater initial drop in A1c in the first year of therapy and TZD therapy is associated with a larger decrement in A1c throughout 2 years of therapy, it appears that TZD therapy and insulin therapy are equally efficacious over an extended period of time.
Regarding hypoglycemic episodes, results differed within each group. In the TZD group, the mean frequency of hypoglycemic episodes significantly increased only during year 2. Because 78% of these patients were also on a sulfonylurea during this time (compared with 76% at baseline), it is possible that this medication contributed to the increase. In the insulin group, mean frequency of hypoglycemic episodes increased significantly during all follow-up years. Additionally, direct comparisons between the two groups revealed that the insulin therapy group exhibited a marginally greater increase in hypoglycemia during year 2, and a significantly greater increase in hypoglycemia during years 1 and 3. Such findings are comparable to those from the UKPDS trial, which demonstrated that intensive therapy (i.e., pharmacological agents) increased the prevalence of hypoglycemia when compared with conventional therapy (i.e., diet), and that the prevalence was highest among patients using insulin therapy.[30] Our results are also in line with previous studies indicating that while TZDs are associated with a low risk of hypoglycemia, insulin therapy is associated with a significantly higher risk of hypoglycemia.[20-23] Overall, it appears that TZD therapy is associated with less hypoglycemia than insulin therapy, not only initially but also over the long term.
In line with previous studies, TZD therapy was associated with modest weight gain over time.[16,18,19] The TZD patient’s average weight gain during each of the follow-up periods was 0.8 kg (year 1), 3.0 kg (year 2), and 3.3 kg (year 3). This magnitude of weight gain is comparable to that found in Grossman’s review of pioglitazone, whereby weight gain ranged from 0.5 to 3.7 kg.[28]
When directly comparing therapy groups, our results revealed that weight gain did not significantly differ at follow-up years 1 and 2. However, during year 3 weight gain was significantly greater in the insulin group than in the TZD group. Such findings suggest that although weight gain is initially similar, insulin therapy is ultimately associated with a slightly greater weight gain than TZD therapy. Consideration of absolute mean weights each year showed the TZD group to weigh significantly more than the insulin group at baseline. Furthermore, despite the insulin group’s significantly greater weight gain in year 3, the absolute mean weights of the two groups were similar at the year 3 follow-up. Taken together, these results indicate that both TZD and insulin therapy are associated with modest weight gain, and that the two therapies have similar results over an extended period of time in terms of absolute weight.
This study had some limitations. First, the direct comparison of the insulin and TZD groups was difficult because the groups were different at baseline. The insulin group was significantly older, had a longer duration of diabetes, and weighed less than the TZD group. Second, the study’s assessment of safety and efficacy was limited by the fact that 100% follow-up was not obtained, although a similar proportion of patients were lost to follow-up in each group (23% in the TZD group and 19% in the insulin group). Third, because hypoglycemia was self-reported, it is possible that patients may have overestimated or underestimated the number of hypoglycemic episodes they experienced per month. Finally, follow-up visits to endocrinologists outside our teaching and treatment centre, visits to primary care providers, and phone contact between insulin patients and endocrinologists were not recorded in our centre’s clinical database, so we were unable to factor these costs into our analyses. Thus, the values presented in the present study may underestimate the total cost of treatment for both therapies. It is also worth noting that 14% of the TZD group had to discontinue TZD therapy and that 2% of this group eventually had insulin added to their therapy, suggesting that a small proportion of patients who initiate TZD therapy rather than insulin may eventually incur the costs of insulin initiation.
Limitations aside, this study was the first in Canada to examine the cost of initiating and maintaining patients on TZD therapy versus insulin therapy. When deciding between these two safe and efficacious therapies, cost clearly becomes a key factor. Unfortunately, there is a tendency to draw conclusions about differences by examining the cost of TZDs and the cost of insulin in isolation rather than by considering all the expenses associated with each therapy.
We found that the initial annual isolated cost of TZDs ($1045.44) was significantly greater than the annual isolated cost of insulin ($600.00). However, starting patients on insulin therapy is ultimately greater than the cost of starting patients on TZDs because insulin patients need to use more blood glucose monitoring strips and need to attend an instructional clinic. The cumulative costs of maintaining patients on TZD therapy and insulin therapy remain comparable even after 3 years of treatment. Our results underscore the fact that TZD therapy is not more expensive when looked at in its entirety and is actually cheaper to initiate than insulin therapy.
Our findings demonstrate that both TZD therapy and insulin therapy are efficacious and well tolerated over a 3-year period in patients with type 2 diabetes. Additionally, our study shows that when all costs are taken into consideration, TZD therapy is less expensive than insulin therapy in the short term and comparable in cost to insulin therapy in the long term.
Competing interests
This study was funded entirely by the Endocrine Research Society. In the past, Dr Tildesley has received funds for unrelated projects and for speaking from numerous companies, including GlaxoSmithKline, Eli Lilly, Pfizer, Servier, and Novo.
References
1. Meltzer S, Leiter L, Daneman D, et al. Clinical practice guidelines for the management of diabetes in Canada. Canadian Diabetes Association. CMAJ 1998;159(suppl):S1-S29. PubMed Abstract Full Text
2. Goldstein, BJ. Insulin resistance as the core defect in type 2 diabetes mellitus. Am J Cardiol 2002;90(suppl):3G-10G. PubMed Abstract Full Text
3. Gerber P, Lubben G, Heusler S, et al. Effects of pioglitazone on metabolic control and blood pressure: A randomised study in patients with type 2 diabetes mellitus. Curr Med Res Opin 2003;19:532-539. PubMed Abstract Full Text
4. Poulsen MK, Henriksen JE, Hother-Nielsen O, et al. The combined effect of triple therapy with rosiglitazone, metformin, and insulin aspart in type 2 diabetic patients. Diabetes Care 2003;26:3273-3279. PubMed Abstract Full Text
5. American Diabetes Association. Implications of the United Kingdom Prospective Diabetes Study. Diabetes Care 2002;25(suppl 1):28-32.
6. Stratton IM, Adler AI, Neil HAW, et al. Association of glycemia with macrovascular and microvascular complications of type 2 diabetes (UKPDS 35): Prospective observational study. BMJ 2000;321:405-412. PubMed Abstract Full Text
7. Canadian Diabetes Association Clinical Practice Guidelines Expert Committee. Canadian Diabetes Association 2003 Clinical Practice Guidelines for the Prevention and Management of Diabetes in Canada. Can J Diabetes 2003;27(suppl 2):s18-s21.
8. Canadian Diabetes Association Clinical Practice Guidelines Expert Committee. Canadian Diabetes Association 2003 Clinical Practice Guidelines for the Prevention and Management of Diabetes in Canada. Can J Diabetes 2003;27(suppl 2):s37-s43.
9. Schoonjans K, Auwerx J. Thiazolidinediones: An update. Lancet 2000;355:1008-1010. PubMed Abstract Full Text
10. Parulkar A, Pendergrass ML, Granda-Ayala R, et al. Nonhypoglycemic effects of thiazolidinediones. Ann Intern Med 2001;134:61-71. PubMed Abstract Full Text
11. Spiegelman BM. PPAR-gamma: Adipogenic regulator and thiazolidinedione receptor. Diabetes 1998;47:507-514. PubMed Abstract Full Text
12. Goke B, Lubben G, Bates PC. Coefficient of beta-cell failure in patients with type 2 diabetes treated with pioglitazone or acarbose. Exp Clin Endocrinol Diabetes 2004;112:115-117. PubMed Abstract Full Text
13. Finegood DT, McArthur MD, Kojwang D, et al. Beta-cell mass dynamics in Zucker diabetic fatty rats. Rosiglitazone prevents the rise in net cell death. Diabetes 2001;50:1021-1029. PubMed Abstract Full Text
14. Pavo I, Jermendy G, Varkonyi TT, et al. Effect of pioglitazone compared with metformin on glycemic control and indicators of insulin sensitivity in recently diagnosed patients with type 2 diabetes. J Clin Endocrinol Metab 2003;88:1637-1645. PubMed Abstract Full Text
15. Campbell IW. Long-term glycaemic control with pioglitazone in patients with type 2 diabetes. Int J Clin Pract 2004;58:192-200. PubMed Abstract
16. Chiquette E, Ramirez G, DeFronzo R. A meta-analysis comparing the effect of thiazolidinediones on cardiovascular risk factors. Arch Intern Med 2004;164:2097-2104. PubMed Abstract Full Text
17. Ceriello A, Johns D, Widel M, et al. Comparison of effect of pioglitazone with metformin or sulfonylurea (monotherapy and combination therapy) on postload glycemia and composite insulin sensitivity index during an oral glucose tolerance test in patients with type 2 diabetes. Diabetes Care 2005;28:266-272. PubMed Abstract Full Text
18. Dailey GE 3rd, Noor MA, Park J, et al. Glycemic control with glyburide/metformin tablets in combination with rosiglitazone in patients with type 2 diabetes: A randomized, double-blind trial. Am J Med 2004;116:223-229. Full Text
19. Miyazaki Y, Mahankali A, Matsuda M, et al. Improved glycemic control and enhanced insulin sensitivity in type 2 diabetic subjects treated with pioglitazone. Diabetes Care 2001;24:710-719. PubMed Abstract Full Text
20. Jovanovic L, Hassman DR, Gooch B, et al. Treatment of type 2 diabetes with a combination regimen of repaglinide plus pioglitazone. Diabetes Res Clin Pract 2004;63:127-134. PubMed Abstract Full Text
21. Miyazaki Y, Matsuda M, DeFronzo RA. Dose-response effect of pioglitazone on insulin sensitivity and insulin secretion in type 2 diabetes. Diabetes Care 2002;25:517-523. PubMed Abstract Full Text
22. Van Staa T, Abenhaim L, Monette J. Rates of hypoglycemia in users of sulfonylureas. J Clin Epidemiol 1997;50:735-741. PubMed Abstract
23. Miller CD, Phillips L, Ziemer DC, et al. Hypoglycemia in patients with type 2 diabetes mellitus. Arch Intern Med 2001;161:1653-1659. PubMed Abstract Full Text
24. Brandle M, Zhou H, Smith BRK, et al. The direct medical cost of type 2 diabetes. Diabetes Care 2003;26:2300-2304. PubMed Abstract Full Text
25. Selby JV, Ray GT, Zhang D, et al. Excess costs of medical care for patients with diabetes in a managed care population. Diabetes Care 1997;20:1396-1402. PubMed Abstract
26. Caro JJ, Ward AJ, O’Brien JA. Lifetime costs of complications resulting from type 2 diabetes in the US. Diabetes Care 2002,25:476-481. PubMed Abstract Full Text
27. Hogan P, Dall T, Nikolov P; American Diabetes Association. Economic Costs of Diabetes in the US in 2002. Diabetes Care 2003;26:917-932. PubMed Abstract Full Text
28. Grossman LD. New solutions for type 2 diabetes mellitus: The role of pioglitazone. Pharmacoeconomics 2002;20(suppl 1):1-9. PubMed Abstract
29. Dormandy JA, Charbonnel B, Eckland DJ, et al. Secondary prevention of macrovascular events in patients with type 2 diabetes in the PROactive Study (PROspective pioglitAzone Clinical Trial In macroVascular Events): A randomised controlled trial. Lancet 2005;366:1279-1289. PubMed Abstract Full Text
30. UK Prospective Diabetes Study (UKPDS) Group. Intensive blood-glucose control with sulphonylureas or insulin compared with conventional treatment and risk of complications in patients with type 2 diabetes (UKPDS 33). Lancet 1998;352:837-853. PubMed Abstract Full Text
Cristina M. Aydin, BSc, Richard Taylor, BSc, Emma 0. Billington, BSc, Hugh D. Tildesley, MD
Ms Aydin, Mr Taylor, and Ms Billington are research assistants, Diabetes Research, Division of Endocrinology, at St. Paul's Hospital in Vancouver, British Columbia. Dr Tildesley is an endocrinologist at St. Paul’s Hospital and a clinical associate professor in the Department of Medicine at theUniversity of British Columbia.
